First, a little about who we are and why we wrote this article (or “mini-research piece”). Some of us have worked in the retail forex dealing/brokerage industry since the mid-1990s, collectively accumulating decades of experience. As part of our jobs, we have interacted extensively with retail clients. Some of us worked directly with client support, in client support roles, and some of us indirectly, through investigating trade disputes or developing financial products and incentive programs (e.g., trading conditions, bonuses, etc.). In short, we collectively have a good understanding of how retail traders trade. And we hope our perspective on why retail day trading is hard and why most traders fail will be interesting and perhaps even helpful.
The Harsh Reality of Retail Trading: What’s Really Holding Traders Back?
While researching this article, we spent a great deal of time on various social media platforms to investigate why retail traders themselves believe they lose money. We were surprised to see that such discussions frequently focus on brokers allegedly manipulating trades, markets being rigged, or the new latest “holy grail” concept that supposedly “explains” everything, but doesn’t consistently work (for some reason).
Whenever people ask for advice on how to stop losses (no pun intended) and cross over into the realm of profits, their colleagues suggest working on their risk management techniques. In and by itself it is a solid piece of advice. Some go even further, suggesting that a faulty mental setup or unchecked emotions are to blame, and that the solution lies in controlling emotions, improving trading psychology, and exercising greater discipline. In subsequent passages, we’ll explore whether these factors genuinely address the chronic underperformance seen among so many traders.
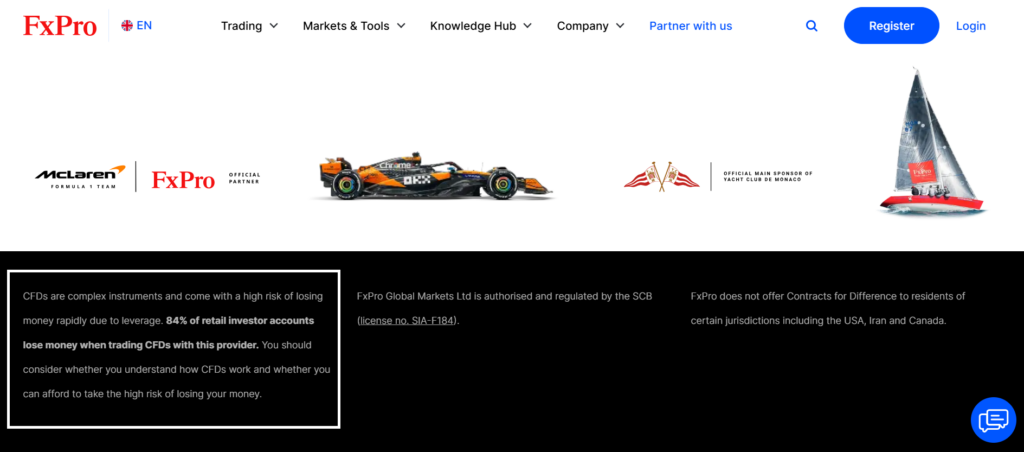
Most people have heard the claim that around 90% of retail day traders lose money. Indeed, various academic studies confirm that the vast majority of traders do lose in the long run. However, those studies often do not fully explore the reasons behind these losses. That gap is what we aim to address in today’s article.
Although that 90% figure might vary by study or broker, it generally supports the idea that day trading is hard. However, we must understand that this statistic is usually a snapshot in time and may not reveal the complete picture. For instance, consider a forex broker examining client performance from January 1, 2024, through December 31, 2024. This sample includes all accounts that lost money during that period. But it excludes those who opened an account in that same timeframe, started trading, yet did not lose money by December 31—perhaps because their losses occurred later (e.g., January 2, 2025). Thus, the real percentage of losing traders might be even higher than that single snapshot suggests.
In any case, our primary objective is not to debate the exact percentage of losing traders. We want to share our experience and insights into why day trading is so hard and why so many retail traders tend to lose money. And we hope to offer a fresh perspective on the subject, a perspective based on years of experience and backed up by science. Let us jump right in.
How Do Beginners Make Day Trading Hard For Themselves?
Have you heard the popular saying: “The definition of insanity is doing the same thing over and over again and expecting a different result“?
It’s not a literal medical or dictionary definition of insanity. But it does highlight the folly of stubbornly repeating past actions that have already proven unfruitful. Unfortunately, in trading, this pattern often becomes self-perpetuating. But how so?
Every day, someone new decides to become a trader. Perhaps they are intrigued by stories of quick gains or simply seeking a new challenge. Many of these beginners take to social media and ask, “Where do I start?” or “What should I learn first?” The issue here is that they are often seeking guidance from people who are themselves likely part of the statistics.
If those giving advice have been repeating losing methods, it’s reasonable to question whether their advice will genuinely help newcomers. Paradoxically, however, the very same individuals end up telling new traders what to do. And that is one of the reasons how they perpetuate the cycle of ineffective methods and approaches.
But What Are These Concepts and Methods?
Some of these concepts do have proper academic backing and are widely used by industry professionals, some of them are completely fabricated. Let’s take technical analysis for instance. Historically, technical analysis has been heavily promoted throughout the trading world. However, the retail community has adopted its most pervasive forms without much scrutiny.
All too often, self-appointed gurus base their entire spiel on technical analysis and pass it off as the ultimate tool to success. “Memorize a handful of chart patterns and you’re supposedly on the path to success.” Countless “cheat sheets” circulate online, listing various chart patterns. However, few people talk about the limitations of technical analysis. Everyone seems focused on its purported ability to predict future trends. Can it though? It depends.
Worse yet, almost nobody attempts to verify the validity of these claims. If you dare question a newly minted “guru” who pushes these concepts, you may find yourself treated like the village idiot by others on forums or subreddits. Trust us—we’ve tried, as part of our research.
How Do “Mentors” Exacerbate The State of Things?
Another common scenario involves novice traders looking for “mentors,” presumed to pass down their “sacred” knowledge. On one hand, it’s understandable—people naturally seek authoritative figures. On the other hand, when you’re risking hard-earned money, it makes sense to question whether these self-proclaimed mentors offer anything of real value. Yet many retail traders fail to ask even the most basic of questions, not to mention conduct a proper due diligence:
- Who is this person, really, and why should I listen to them? What’s their professional, educational background?
- Does what they teach have any academic or professional backing?
- What is this person’s actual track record?
At best, a “mentor” might offer common knowledge that anyone could find freely. At worst, they fabricate an entire universe of fake concepts, complete with their own lore. These gain traction among retail traders and the whole thing becomes self-sustaining, almost cult-like. The problem with that none of these have any real scientific backing. In finance and economics, groundbreaking ideas are typically supported by extensive research and attract lots of attention from the Wall Street.
Once someone is deeply committed, even irrefutable evidence to the contrary won’t convince them otherwise. We see this phenomenon in groups dedicated to certain trading “schools,” where many claim they are “profitable” thanks to using guru’s methods, yet offer no data to back their claims up and you won’t see these folks featured in major financial outlets. They, too, are often part of the losing-trader statistics.
Retail vs. Professional Market Participants: Key Differences
Institutions such as professional money management firms, hedge funds, commercial banks, and other large financial entities heavily rely on the scientific method in various aspects of their operations. They apply rigorous data analysis, build econometric models, and utilize cutting-edge research in economics, mathematics, and statistics to set capital market expectations. These methods help them evaluate the performance of portfolio managers, identify opportunities, and effectively manage risk.
How Do Institutions Evaluate Their Performance?
Institutional portfolio management is an incredibly competitive field. Firms operating in this space use a variety of metrics to present their performance to potential clients and to test their investment strategies. But why complicate things? If an investment grows, doesn’t that prove they are doing a good job? Not necessarily.
Consider this: What if a portfolio manager has simply been buying stocks in a rising market? Did they select those stocks based on skill and insight, or were they just lucky? This is one of the many reasons firms present multiple performance metrics when demonstrating their results. They analyze how individual portfolio managers and trading strategies perform under different market conditions to distinguish between skill and market-driven returns.
But how do they do this? Firms use a variety of techniques, including factor attribution models to break down returns into skill-based and market-driven components, and stress testing to evaluate how portfolios might react to hypothetical market shocks. These tools help assess the robustness of investment strategies beyond just raw performance numbers.
Key performance metrics drive rebalancing decisions or tactical adjustments. Firms continuously monitor risk exposure and performance, updating models whenever new data becomes available. Institutions frequently use quantitative data (e.g., returns, volatility, drawdowns) to find managers who can deliver alpha (excess returns above a benchmark). Beyond numbers, they also consider a manager’s investment philosophy, historical decision-making process, and the robustness of their strategy (qualitative assessment).
The Retail Trader Contrast
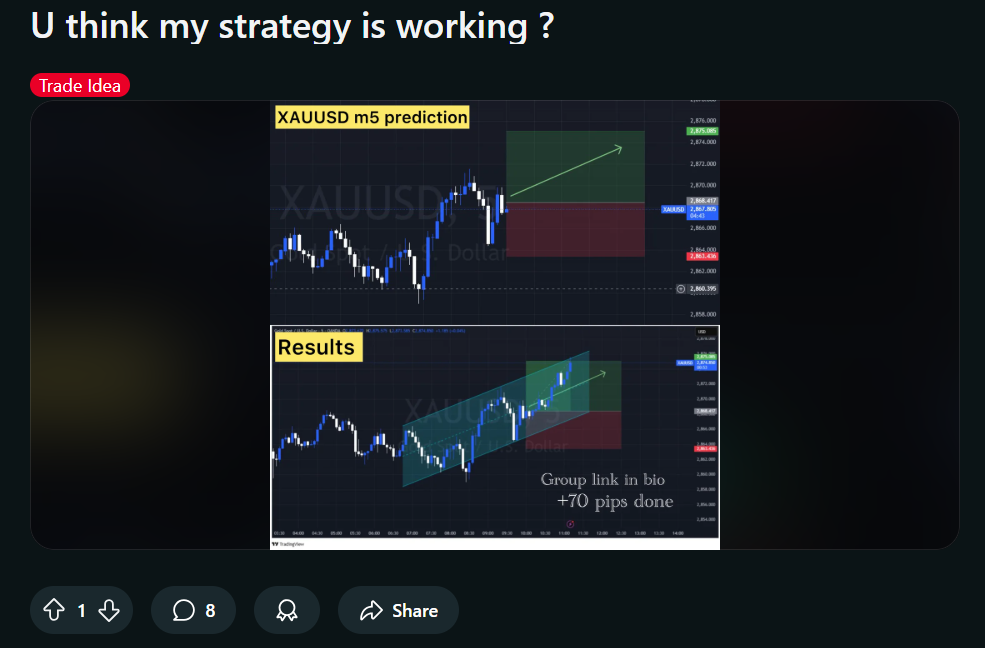
In contrast, the retail trading community often relies on far more rudimentary methods (e.g. win rate, average win, average loss etc). All too often, we see social media posts where someone shares a screenshot of a handful of trades. They then proclaim their strategy “works” based just on that piece of, erm, erm, “evidence”. Some of them even start offering their portfolio management services, signals etc. We can’t reliably verify for how many people this information is sufficient to convince them, but surely if these posts appear on a regular basis, there must be a lot of them. And naturally, there’s typically no follow-up posts or large sample sizes to back up their performance claims. Unfortunately, many of these claims disappear after a short time, without a trace.

Limited Verification and Testing
What many people don’t realize is that screenshots can be cherry-picked or might reflect a lucky streak, rather than systematic, long-term success. Or they can be flat out doctored. Retail traders seldom use robust metrics to measure performance or risk. Very often, they are not even aware such metrics exist. Even a trading statement would at least provide some evidence of a real track record. However, these are rarely shared in full.
Few attempt to investigate or replicate how professional firms test strategies or evaluate risk-adjusted returns. Professionals rely on an arsenal of risk and performance metrics. Retail traders either overlook them or are not aware of their existence. Here are a few examples of the most basic and well-known metrics used by professionals.
Sharpe Ratio measures how well the portfolio compensates investors for the risk they take. A higher Sharpe Ratio generally indicates better risk-adjusted performance.
Roy’s Safety-First Criterion (Roy’s Ratio) looks at returns relative to a certain minimum acceptable return (MAR) or threshold. It weighs the downside risk of not meeting the MAR. It is especially useful for investors who have specific loss thresholds or required returns.
Standard Deviation is a basic statistic that measures how much returns vary around the average (mean) return. It helps gauge the volatility of the strategy or portfolio. Higher standard deviation suggests larger swings in returns, which may imply higher risk.
Additional metrics such as the Sortino Ratio (which focuses only on downside volatility) or the Treynor Ratio (which uses beta relative to a benchmark) are also popular in institutional settings.
Why Do These Metrics Matter?
Merely looking at raw returns can be misleading. High returns with extremely high volatility (or drawdown risk) might not be sustainable. Standardizing performance through ratios allows investors to compare strategies with different risk profiles on an apples-to-apples basis. Professionals focus on consistent performance over multiple market cycles, rather than short-term streaks.
It Is All About Emotions and Psychology Man!
In and of itself, the advice to be disciplined and take your trading psychology to a whole new level is solid. Every other post in popular trading communities touches on this subject in one way or another. Retail traders love, love, love to chinwag on the topic of trading psychology, getting emotions under control (often in very naive and simplistic ways, without going into the nitty gritty of things). But if you examine these conversations under a microscope, they often fall apart.
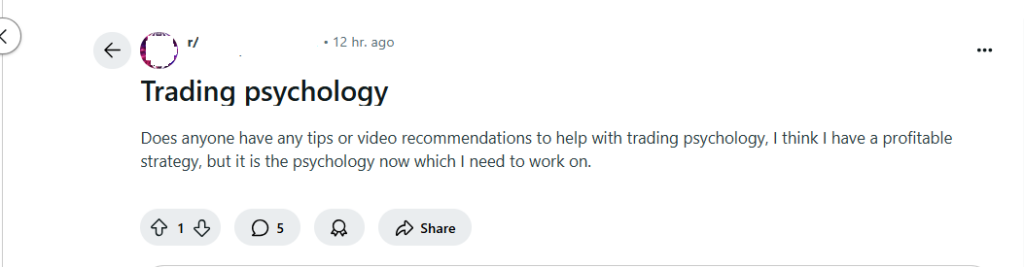
But let’s humor this idea for a moment. Realistically, how easy is it to stay disciplined, turn off your emotions at will, or change your habits? The short answer: it’s not as easy as these discussions make it sound.
Let me watch a couple of TikToks and I am golden.
Human beings are emotional creatures, and no amount of self-control will change that fact. Yes, we can adjust our behavior to some extent if we really put our minds to it, but our brains evolved to respond to certain stimuli in specific ways. And in stressful situations, we are more likely to fall back into “preprogrammed” behavioral patterns.
The way we process information isn’t perfect either, and that imperfection shows up as biases. What are biases? In short, biases are errors in how we gather, process, and interpret information. There’s an entire field of study in finance dedicated to this topic, known as behavioral finance.
Behavioral Finance
Behavioral finance distinguishes two primary categories of biases: сognitive and emotional.
Cognitive Biases arise from logical errors or flawed reasoning, such as poor memory or incorrect information processing. They can often be addressed or mitigated by appealing to logic and reason. Once you recognize a cognitive bias, you can work to correct or minimize it.
Emotional Biases stem from deeply rooted feelings, impulses, or personal experiences (e.g., fear, greed). They are typically more difficult to correct because they are tied to a person’s emotional makeup. Rather than being “fixed,” they are often managed or accommodated.
In private wealth management, advisors are trained to recognize and work around emotional biases. Why? Because attempting to “cure” them is usually impossible. Instead, investment or trading strategies incorporate an acknowledgment of these biases and are designed to limit their negative impact on decision-making.
Relapse and Habit-Forming Behaviors
Biases share some similarities with bad habits. Just like bad habits, biases are ingrained in our thinking patterns and behavior. We default to them without conscious effort, making them difficult to change. Many biases operate beneath our awareness, just like biting nails or procrastinating. We act on them without realizing it, and they often reinforce themselves over time. A trader who repeatedly blames bad trades on external factors (confirmation bias) or keeps losing trades (loss aversion bias) is reinforcing a mental pattern, much like someone who reaches for junk food when stressed.
What Do We Know About Changing Bad Habits?
Consider everyday habits like smoking, drinking, eating junk food, or drug use. People frequently attempt to quit, but success rates vary. According to data from the National Institute on Drug Abuse (NIDA), 40–60% of individuals who receive treatment for substance use disorders end up relapsing at some point. In other words, even with strong motivation, knowledge, and support, habitual behavior is incredibly difficult to change. The same principle applies to emotional biases in trading: simply knowing about them is not always enough to prevent a relapse into old, unhelpful patterns.
“Yeah, man, you just have to step up your trading psychology game.”– A quote from a typical trading community post.
Do I Need a Mentor?
Earlier, we discussed that many retail traders seek out authoritative figures and imitate what other traders are doing. This phenomenon is known as herding behavior (or sometimes the bandwagon effect). It describes the tendency to follow and trust what a large group, or seemingly authoritative individuals, are doing. Very often, it happens without investigating the underlying logic or evidence.
“I’m Not Like Those Other Losers”
A common cognitive bias that captures this sentiment is known as the Dunning-Kruger Effect. Discovered by psychologists David Dunning and Justin Kruger in 1999. It occurs when individuals with limited knowledge or skill in certain area overestimate their own competence, often failing to recognize their deficiencies.
Dunning-Kruger Effect is a well-documented and widely accepted psychological finding. In their original study, Dunning and Kruger demonstrated that people with poorer performance in tasks like logical reasoning or grammar often rated themselves higher than average, whereas more competent individuals tended to underestimate their abilities.
Imagine a new trader who has watched a few YouTube tutorials on technical analysis and read a couple of blog posts. This trader might assume they’ve mastered the fundamentals of day trading and believe that, unlike the “losers” who make up the majority of retail traders, they will easily beat the market. A few early wins may reinforce this inflated self-assessment. Overconfidence sets in, leading to excessive leverage or risky trades. Unfortunately, the market is quick to punish unfounded arrogance. Eventually, losing streaks or market volatility reveals the depth of the trader’s inexperience.
“Recommend Me the Best Broker!”
If you spend any time on trading forums or social media groups, eventually you’ll see posts like this. People aren’t asking how to evaluate or find the best broker; they simply want someone else to hand them a recommendation. In other words, they aren’t willing to roll up their sleeves and learn how to conduct due diligence on their own. Instead, they shift responsibility towards others.
This behavior often reflects aspects of the “authority bias,” where individuals prefer to rely on perceived experts or popular community figures rather than doing their own research. It can also involve “locus of control” issues—some traders outsource decision-making and accountability, hoping someone else’s authority will shield them from the consequences of a poor choice.
You’ll see this pattern repeated everywhere:
“Recommend me the best broker.”
“Recommend me the best trading course.”
“Suggest me the best teacher or mentor.”
In each case, the person posting is looking for a shortcut or a guarantee from someone else. They are not trying to learn how to verify credentials, compare offerings, and take responsibility for their decisions.
“Just Learn These Candle Formations, Bro”
A common refrain across YouTube channels, Reddit threads, and other trading forums is that if you just memorize a handful of “secret” candle patterns, you’ll have everything you need to succeed. Like we mentioned above, there are PDF cheat sheets circulating the internet, promising a 100% effective remedy for trading woes: Learn this, and you’ll get that. Yet, nobody mentions limitations or downsides. In an earlier discussion, we touched on how technical analysis relies on the idea that certain patterns repeat themselves.
The Pattern Recognition Trap
From an evolutionary standpoint, our brains have adapted to spot patterns. This is, after all, how humans learn. Our hunter-gatherer ancestors, for example, needed to recognize subtle changes in animal tracks or weather patterns to find food and avoid predators. This innate ability has been crucial to our survival. However, the same tendency can be a double-edged sword in trading. The ability that helped us survive once forces us to detect patterns where none actually exists.
The human tendency to perceive patterns and connections in random data is known as apophenia. In trading, this can manifest as pareidolia, where traders “see” familiar formations, like head-and-shoulders patterns or double tops, even in completely random price movements. Research in cognitive psychology and behavioral finance has shown that people often mistake randomness for meaningful structure, leading them to place trades based on illusory correlations rather than actual statistical edges.
Furthermore, studies on the gambler’s fallacy and overfitting in financial markets suggest that many traders subconsciously seek patterns because our brains are wired to expect order in chaos. But just because a pattern has worked in the past doesn’t mean it has predictive power. In reality, many commonly used chart formations lack statistical significance when tested on large datasets. This illusion of certainty can lead traders to overestimate their ability to predict the market, reinforcing false confidence and poor risk management.
Cherry on Top
To underscore our point, we’d like to share some statistics gathered over the years. You can learn quite a bit about the average retail trader by examining the types of issues they raise with a broker’s client support team. While forums may buzz with “sophisticated” topics like trading psychology, risk management, “fair value gaps,” and “liquidity sweeps”—in reality, a large number of traders struggle with basic tasks, such as logging in to their accounts, setting up their trading platforms, or understanding how different order types relate to the bid-ask spread. Even simpler administrative tasks—like uploading a utility bill or verifying an ID—end up generating the bulk of support requests. In fact, these types of queries typically account for 70–75% of all client support interactions.
Conclusions
Professional money managers and institutional traders rely on in-depth research, sophisticated models, and robust risk metrics to make informed decisions and gauge performance. Meanwhile, many retail traders base their strategies on anecdotal evidence, incomplete data, or unverified social media “concepts”.
Retail traders invest hours and hours in looking for shortcuts, magic pills and get-rich-quick schemes, instead of investing their time and very often money into old-fashioned education, learning things that are taught to finance professionals, macroeconomics, financial math or statistics. Ultimately, many of them fall prey to various scams or devote countless hours to learn unscientific methods.
This doesn’t mean all retail traders are alike. The retail trading community is diverse, representing people from every walk of life. Naturally, some are more capable than others (and may not even realize it). Still, in this article, we’ve painted the “average” retail trader with broad strokes, highlighting some common pitfalls.
Learning and adopting professional practices such as using risk-adjusted metrics can help close this gap, reduce guesswork, and potentially improve long-term outcomes for retail market participants.
Break the cycle. Rise above. Focus on science.