Technical analysis is one of the most widely used—and most debated—approaches to financial-market analysis. Traders use everything from trendlines, chart patterns and support and resistance levels to moving averages, momentum indicators and more elaborate trading systems, all based primarily on information contained in past prices.
But asking whether technical analysis “works” is not as simple as it sounds. Technical analysis is not a single method, and working can mean very different things. A pattern might contain some predictive information without producing a profitable trading strategy. A rule might perform well in historical data but fail out of sample. And a strategy that appears profitable before trading costs, slippage and repeated testing may lose that advantage once those factors are taken into account.
The academic evidence reflects this complexity. Some technical trading rules and price-based signals have shown predictive or economic value in particular markets and periods, including foreign exchange. At the same time, many apparently successful strategies become far less convincing once researchers account for data mining, transaction costs and changing market conditions.
So rather than treating technical analysis as either a proven forecasting tool or complete nonsense, we will ask a more useful question: what does the evidence actually show, which forms of technical analysis can be tested objectively, and under what conditions—if any—do they appear to provide an edge?
What Technical Analysis Actually Assumes
At its broadest, technical analysis attempts to extract useful information about future price behavior from past market data, primarily price movements and transformations derived from them. The underlying idea is not necessarily that markets repeat themselves in exactly the same way, but that historical prices may contain patterns or dependencies that provide information about what is more likely to happen next.
That definition covers a much wider range of methods than manually drawing lines on a chart. A trend-following strategy, for example, assumes that price movements may persist for some period. A mean-reversion strategy looks for movements that may subsequently reverse. Other approaches use moving averages, momentum indicators, support and resistance levels, candlestick formations or more complex combinations of price-based signals.
This distinction matters because these methods do not all make the same prediction. Technical analysis is therefore not synonymous with trying to identify market tops and bottoms, nor does it depend on the assumption that a particular market cycle or pattern will repeat on schedule.
However, while we can observe these patterns, the actual process driving these changes often remains hidden. In this sense, technical analysis operates like a black box—something is happening, even though we can’t directly see it.
Discretionary Chart Analysis vs. Systematic Trading Rules
Another important distinction is between discretionary technical analysis and systematically defined technical rules.
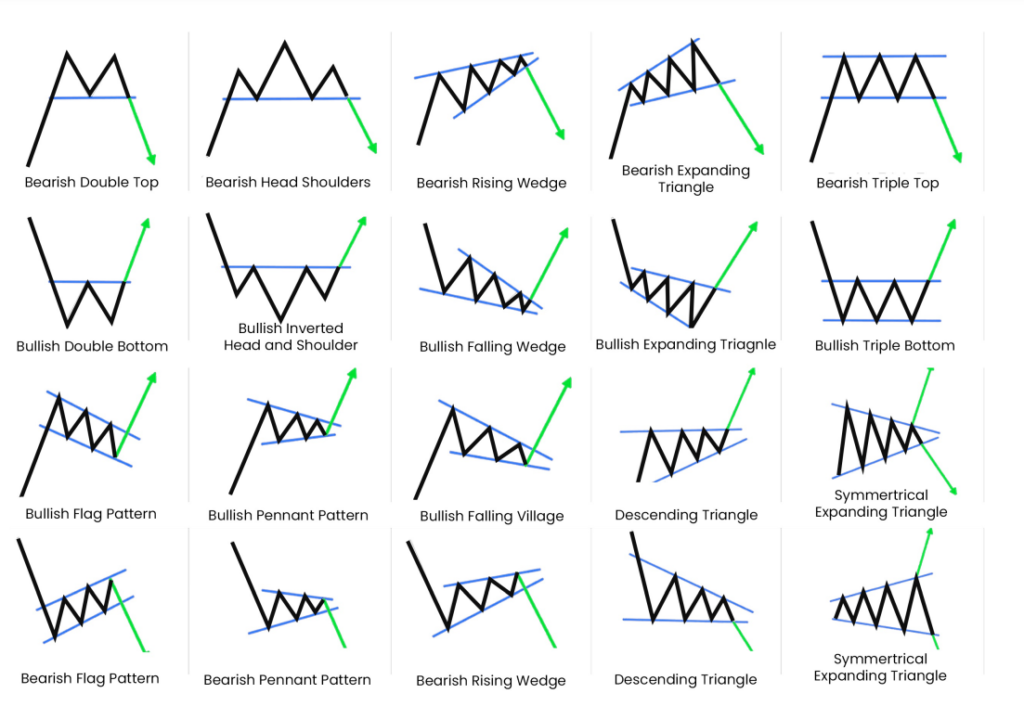
With discretionary chart analysis, the trader interprets features such as trendlines, chart formations or support and resistance levels. Two analysts can look at the same chart and disagree about whether a pattern exists, where it begins or what it implies.

Image 1: This is an example of the documents circulating in different trading communities.
DISCLAIMER: The image above is provided for demonstration purposes only. It does not constitute an investment advice.
This subjectivity has long been recognized as a problem when technical analysis is studied scientifically. If a pattern cannot be defined consistently, it becomes difficult to determine whether it has genuine predictive value or whether the interpretation is being influenced by what happened afterward.
A systematic rule is different. Instead of saying that a chart “looks bullish,” the conditions for generating a signal are specified precisely enough that they can be coded and applied to the same data by another researcher. That makes the hypothesis reproducible and allows it to be tested across different markets, time periods and data that were not used to design the rule.
This does not mean that a systematic rule must work. It simply makes the claim testable.
Prediction Is Not the Same as Explanation
Technical analysis also does not necessarily explain why a price movement occurs.
A relationship can potentially contain forecasting information without identifying the economic mechanism responsible for it. For example, a price-based rule might detect persistence in returns without explaining whether that persistence results from investor behavior, institutional trading, information arriving gradually or some other market mechanism.
That is not automatically a weakness. Forecasting models in many fields can be useful without providing a complete causal explanation. But when the underlying mechanism is uncertain, rigorous testing becomes even more important. A pattern found in historical data may represent a genuine regularity—or it may simply be coincidence, overfitting or the result of searching through enough possible patterns until something appears to work.
That distinction takes us to the central question: how do we determine whether an observed market pattern contains genuinely useful information rather than merely looking convincing in hindsight?
How Do We Test Whether Technical Analysis Works?
Finding a pattern in historical prices is only the beginning. To show that a technical method has value, we need to define what “working” actually means and test the claim accordingly.
There are several different standards we can use.
Predictive Value Is Not the Same as Profitability
A technical signal may contain information about future price movements without producing a profitable trading strategy.
Suppose an indicator makes the correct directional prediction slightly more often than chance. That may represent genuine predictive information. However, the advantage may still be too small to overcome spreads, commissions, slippage and other trading costs.
The reverse distinction also matters. A profitable backtest does not automatically prove that a signal has genuine predictive power. The result may depend on a particular sample, parameter choice or period of unusually favorable market conditions.
For traders, the economically relevant question is therefore not simply whether a pattern exists. It is whether an advantage can survive realistic implementation.
In-Sample Results Are Not Enough
A strategy can look impressive when researchers test it on the same data used to develop it. This is known as in-sample testing.
The real challenge comes when the strategy encounters data that did not influence its design. This is out-of-sample testing.
The distinction matters because historical data make it remarkably easy to discover relationships that happened by chance. Researchers can adjust indicator settings, entry rules, exit rules and holding periods until a combination fits the past particularly well.
A stronger test asks whether the rule continues to perform after those choices have already been made. Some large FX studies have found that technical predictability can survive these stronger tests, although results vary considerably across periods and currencies.
The Data-Snooping Problem
Technical analysis creates an especially difficult statistical problem because traders can test enormous numbers of possible rules.
Consider a moving-average strategy. A researcher can change the length of the fast average, the slow average, entry thresholds, exit rules and dozens of other parameters. The same process can then be repeated across currencies and time periods.
Test enough variations and some will eventually produce excellent historical results by chance alone.
This is known as data snooping, or more broadly as a multiple-testing problem. A strategy should not look convincing merely because it was the winner among thousands of alternatives.
Modern studies of technical trading therefore use statistical methods designed to account for this search process. The question is no longer just whether the best-performing rule made money. Researchers also ask how likely it is that such a winner would emerge simply from testing many rules.
Trading Costs Matter
A statistically detectable pattern is not necessarily an economically useful one.
Technical strategies can generate frequent transactions. Each trade can incur a bid-ask spread, commission, slippage or other execution cost. These costs can consume a small statistical advantage surprisingly quickly.
That is especially important in foreign exchange. A backtest that uses a single midpoint price, ignores spreads or assumes every order executes at the observed price may substantially overstate the return a trader could have achieved.
For this reason, credible evidence should evaluate performance after realistic trading costs wherever suitable data are available.
Does the Edge Persist?
Finally, a useful strategy must do more than explain the past.
Markets change. Participants adapt, technology evolves, liquidity shifts and relationships that once existed may weaken or disappear. A technical rule that performed well during one period may fail during another.
This does not necessarily mean the original result was false. It means that persistence matters.
A convincing test should therefore ask whether a technical rule survives outside the period in which researchers discovered it and whether its performance remains reasonably stable across different market conditions.
These requirements set a much higher bar than finding an attractive chart pattern or profitable backtest. They also help explain why academic studies can reach apparently conflicting conclusions about technical analysis.
The Replication Problem: Can the Signal Be Reproduced?
One of the biggest challenges for technical analysis is reproducibility.
Suppose one trader identifies a head-and-shoulders pattern on a chart. Another trader may place the neckline somewhere else, reject the pattern entirely or interpret the same price action differently.
That creates a basic testing problem. Before we can ask whether a pattern predicts anything, we need to know exactly what qualifies as that pattern.
A reproducible trading rule should define its conditions clearly enough that someone else can apply the same method to the same data and obtain the same signals. This may require precise rules for the pattern, indicator settings, entry conditions, exits and holding periods.
Traditional chart analysis does not always meet that standard. Many formations depend partly on visual judgment, which can make their identification subjective.
Researchers can address this problem by turning chart patterns into explicit algorithms. Once a method produces signals consistently, researchers can test whether those signals contain useful information.
But reproducibility is only the first hurdle.
Can the Result Be Replicated?
A perfectly reproducible strategy can still have no lasting predictive value.
Imagine that a moving-average rule produces exactly the same trades whenever researchers apply it to the same historical dataset. That demonstrates reproducibility. It does not prove that the rule will perform similarly on another currency, during another period or on data that researchers did not use to develop it.
This is where replication becomes important.
If a technical relationship is genuine and sufficiently stable, we would expect evidence of it to appear again under comparable conditions. The results do not have to be identical. Financial markets are probabilistic, and even a strategy with a real statistical edge will produce both winning and losing trades.
What matters is whether the underlying effect remains detectable.
For example, does a rule that outperformed during one sample retain predictive value in a later period? Does it work across several currencies, or only one? Does the result remain after researchers account for trading costs and alternative parameter choices?
Failure to replicate does not automatically prove that the original result was false. Market conditions may have changed, or the relationship may have been temporary. But repeated failure to reproduce an apparent edge outside the conditions in which researchers discovered it should reduce our confidence in that edge.
This is a much more demanding standard than finding several convincing examples on a chart. A technical method becomes scientifically interesting when we can define it, reproduce its signals and then test whether its apparent advantage survives new data.
Technical Analysis Is Probabilistic — But That Is Not Enough
No credible trading method can predict every market movement correctly. Financial markets are uncertain, so any genuine trading edge should be understood in probabilistic terms.
But calling technical analysis “probabilistic” does not tell us whether it works.
Suppose a trading rule signals that EUR/USD is more likely to rise than fall over the next day. The important question is not whether the forecast occasionally fails. It is whether the signal changes the probability of an upward move in a measurable and repeatable way.
That requires a benchmark.
If the market rises 52% of the time during the period being studied, a signal that predicts an increase correctly 52% of the time has added little information. A signal that performs better may be more interesting, but researchers still need to determine whether the difference is statistically meaningful or could have occurred by chance.
Even statistical significance is not enough for a trader. The advantage must also be large enough to survive spreads, commissions, slippage and other trading costs.
This is why individual winning or losing trades tell us very little about the validity of a technical method. A strategy with a genuine statistical edge will still lose sometimes. Likewise, a strategy with no genuine edge can produce long winning streaks by chance.
The relevant evidence comes from a sufficiently large sample of signals. We can then compare their outcomes with an appropriate benchmark and ask whether the result persists on new data.
What Can a Small Statistical Edge Look Like?
A small advantage can be difficult to notice over a few trades but become much more important over a large sample. Use the sliders to see how this works.
What do these numbers mean?
Expected Result: The average result we would expect if we could repeat this whole set of trades many times. Your actual result could be higher or lower.
Typical Variation: This shows roughly how much random variation can move the final result away from the expected result. Statisticians call this standard deviation. A larger number means the possible outcomes are more spread out.
Chance of Finishing in Profit: Given the win rate you selected, this estimates how often the complete set of trades would finish above break-even.
This also changes how we should think about claims such as “this pattern works 70% of the time.” A percentage alone is not enough. We also need to know how the pattern was defined, how many observations were tested, which market and period were used, whether researchers selected the rule after seeing the data, and whether trading costs were included.
Probability is therefore not a defense of technical analysis. It is part of the framework we need to test it.
Can Technical Levels Become Self-Fulfilling?
Technical analysis may sometimes influence the market it attempts to predict.
Imagine that many traders identify the same price as an important support level. Some may place take-profit orders near that level, while others may position stop-loss orders just beyond it. As price approaches the area, those orders can affect order flow and influence what happens next.
This creates a possible feedback mechanism. A technical level may matter partly because market participants act around it.
There is evidence of this effect in foreign exchange markets.
Research by New York Fed economist Carol Osler examined support and resistance levels distributed by six firms active in the FX market. The levels showed an ability to predict intraday trend interruptions, although their predictive power varied across currencies and firms.
Further research examined actual stop-loss and take-profit orders at a large foreign exchange dealing bank. The orders clustered strongly around round-number exchange rates, which often coincide with commonly watched support and resistance areas.
Importantly, different types of orders produced different effects.
Take-profit orders tended to create negative feedback. As traders closed profitable positions, their orders could help slow or reverse an existing move.
Stop-loss orders produced the opposite effect. Once triggered, they could reinforce the direction of the move. When many stop orders clustered near the same level, their execution could contribute to rapid price movements after that level was crossed.
This provides a market-microstructure explanation for two familiar technical observations: prices may sometimes reverse near support or resistance, and moves may accelerate after those levels break.
But this evidence does not mean that every support or resistance line drawn on a chart has predictive value.
The studies examined specific FX markets, particular periods and observable order behavior. They show that clustered orders can create price dynamics around certain levels. They do not validate arbitrary chart patterns or prove that technical levels carry permanent predictive power.
The distinction is important. A price reaction around a technical level does not have to result from a mysterious property of the chart itself. In some cases, the mechanism may be much more concrete: market participants have placed real orders around the same price.
What Does the Evidence Say?
Academic research does not produce a simple yes-or-no verdict on technical analysis.
A major review of the foreign exchange literature by Lukas Menkhoff and Mark Taylor found that technical analysis is widely used by FX professionals and that some technical strategies may be profitable. However, profitability varies across markets and periods.
Testing thousands of strategies also creates a serious problem: some will look successful purely by chance.
One study examined 25,988 technical trading strategies in emerging FX markets. Standard tests identified hundreds or thousands of apparently profitable rules. After the researchers corrected for data snooping, almost all of those results disappeared.
Other studies have found a more nuanced result. Some technical FX rules have remained profitable after researchers accounted for trading costs and data snooping, but their advantage often lasted only for limited periods.
Taken together, the evidence suggests that some price-based signals can contain useful information, but technical trading rules do not provide a universal or permanent edge.
So, Does Technical Analysis Work?
The most defensible answer is: sometimes, under specific conditions—but that is very different from saying that technical analysis reliably predicts markets.
Technical analysis covers everything from subjective chart interpretation to precisely defined quantitative trading rules. We should not evaluate all of these methods as though they were equivalent.
A useful technical signal should meet a much higher standard than looking convincing on a chart. Researchers should be able to define it clearly, reproduce it, test it on new data and determine whether any advantage survives trading costs and alternative parameter choices.
The same standard applies to newer trading frameworks such as ICT, fair value gaps or liquidity sweeps. Complexity does not establish predictive value. If a concept makes a testable prediction, we should be able to define that prediction before seeing the outcome and evaluate it across a sufficiently large sample.
Technical levels can also matter for reasons that have little to do with a chart possessing some inherent predictive property. As we saw earlier, real orders can cluster around widely watched prices and influence short-term market behavior.
That leaves us with a less exciting but much more useful conclusion: technical analysis should be treated as a collection of hypotheses about price behavior, not as a proven forecasting system.
Some of those hypotheses survive serious testing. Many do not.
The only reliable way to tell the difference is to test them.
Frequently Asked Questions
Does technical analysis work in forex?
Sometimes, but not reliably across all trading rules, currencies or periods. Research has found technical strategies that retain predictive or economic value after statistical testing in some samples, while other studies find that apparent profitability weakens or disappears after accounting for data snooping, transaction costs and out-of-sample performance. The evidence therefore supports conditional and time-varying usefulness rather than a universal technical-analysis edge.
Can technical analysis predict market movements?
A validated technical signal may contain information about the probability of a future market outcome, but it cannot predict price movements with certainty. The relevant question is whether a clearly defined signal improves forecasts or trading performance relative to an appropriate benchmark on data that were not used to develop it, after realistic trading costs.
Why can a technical strategy look profitable in a backtest but fail later?
Testing many indicators, parameters and trading rules increases the chance that some will appear successful purely by chance. This is known as data snooping or multiple testing. Overfitting, changing market regimes and costs such as spreads, commissions and slippage can further reduce or eliminate performance when the strategy is applied to new data.
Do support and resistance levels actually matter?
Some price levels can matter under specific market conditions. FX research has found that stop-loss and take-profit orders can cluster around round numbers commonly associated with support and resistance. When those orders are executed, the resulting order flow can contribute to reversals or accelerate an existing move. This provides a market-microstructure explanation for some observed levels, but it does not establish that every support or resistance line drawn on a chart has predictive value.
How should a technical trading strategy be evaluated?
A credible evaluation should define the trading rule before testing, use an appropriate benchmark, separate model development from out-of-sample evaluation, control for repeated testing and include realistic trading costs. Performance should also be examined across different periods and market conditions using both economic and risk-adjusted measures. A profitable historical equity curve alone is not evidence of a persistent statistical edge.
References
Selected academic and institutional sources used in this article.
- Menkhoff, L. & Taylor, M. P. (2007). The Obstinate Passion of Foreign Exchange Professionals: Technical Analysis . Journal of Economic Literature, 45(4), 936–972.
- Lo, A. W., Mamaysky, H. & Wang, J. (2000). Foundations of Technical Analysis: Computational Algorithms, Statistical Inference, and Empirical Implementation . The Journal of Finance, 55(4), 1705–1765.
- Kuang, P., Schröder, M. & Wang, Q. (2014). Illusory Profitability of Technical Analysis in Emerging Foreign Exchange Markets . International Journal of Forecasting, 30(2), 192–205.
- Hsu, P.-H., Taylor, M. P. & Wang, Z. (2016). Technical Trading: Is It Still Beating the Foreign Exchange Market? . Journal of International Economics, 102, 188–208.
- Zarrabi, N., Snaith, S. & Coakley, J. (2017). FX Technical Trading Rules Can Be Profitable Sometimes! . International Review of Financial Analysis, 49, 113–127.
- Osler, C. L. (2000). Support for Resistance: Technical Analysis and Intraday Exchange Rates . Federal Reserve Bank of New York Economic Policy Review, 6(2), 53–68.
- Osler, C. L. (2003). Currency Orders and Exchange Rate Dynamics: An Explanation for the Predictive Success of Technical Analysis . The Journal of Finance, 58(5), 1791–1819.