
In many beginner trading courses and literature, you might come across the phrase “currency pair volatility decreases at night” without explaining how to use this info in your trading. As you read, “volatility was 0.5% during the day and dropped to 0.2% at night.” Okay, cool. You read it, but what are you supposed to do about that? It raises a ton of questions. Like, 0.5% and 0.2% of what? Is 0.5% and 0.2% a lot or a little? How much money is that? Is that high volatility or not? If it’s high, what’s causing it? What about other pairs? Is that the same if EURUSD has 0.5% volatility and XAUUSD also has 0.5%? If not, how much is it in monetary terms? And how do you even calculate volatility in the first place?
What is Currency Market Volatility?
Volatility in the currency market (forex) refers to how much the price of a currency pair fluctuates over a specific period. A high-volatility currency pair experiences significant price swings, while a low-volatility pair has more stable prices.
How Do We Measure Volatility?
Financial professionals typically measure volatility using standard deviation. Volatility is one measure of risk. Higher volatility means greater price fluctuations and potentially higher risk and reward. Volatility can change over time due to various factors, such as economic news, geopolitical events, and market sentiment. Traders use volatility to assess potential profit opportunities, manage risk, and evaluate the effectiveness of trading/investment strategies.
How Do We Calculate Currency Pair Volatility?
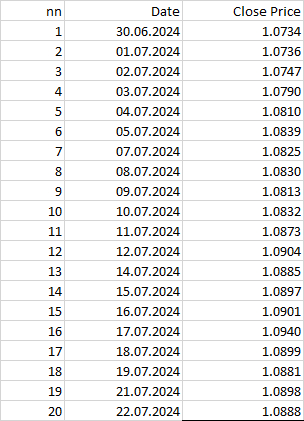
Calculating volatility starts with choosing a calculation period, which determines how many price points we’ll examine. For example, let’s say we want to calculate the volatility or fluctuation of the EURUSD currency pair over the last 20 days—its 20-day volatility. We will use the closing prices for each trading day to keep things simple.
Calculation
Next, we need to do the following calculations:
1) Calculate the logarithmic returns (Ln)1 for each period. We calculate the logarithmic return (log return) as
ri = Ln( Pi / ( Pi−1) )
ri: Represents the result, often called the “log return” or “logarithmic return” for a specific time period i.
Pi: The price or value of an asset at time i.
Pi−1: The price or value of the asset at the previous time period i−1.
Ln: The natural logarithm function.
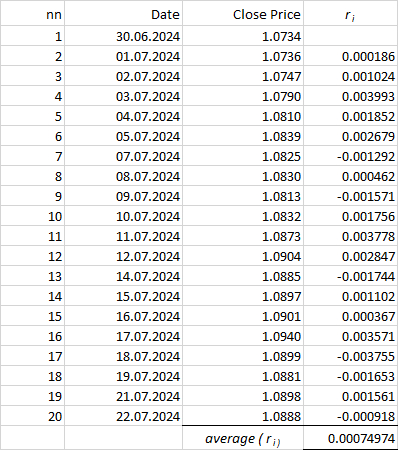
EXAMPLE: To calculate the return of 0.000186, as shown in the table below (third cell from the top in the column labeled ri), we divide the closing price of period 2 (1.0736) by the closing price of the previous period (1.0734), and then take the natural logarithm of the result. Fortunately, we don’t have to do this manually. Simply enter the formula into Excel or Google Sheets, and let them do the calculations for you.
2) Calculate the average logarithmic return. To do this, we need to find the sum of all the numbers in the last column and divide the result by their number by 20 in this case:
3) Calculate the standard deviation of logarithmic returns.
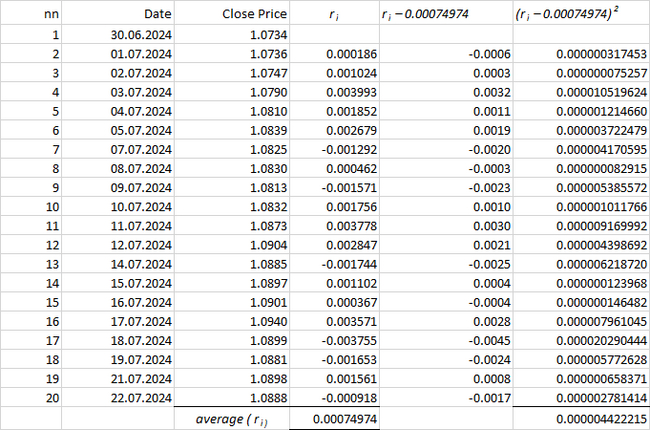
To do this, subtract the calculated average logarithmic return 0.00074974 from each cell value in the ri column, and then square the result (or multiply each result by itself). Almost there: add up all the numbers in the last column and divide the result by 19:
Bassel’s Correction
You may wonder why we are dividing by 19 instead of 20. We had 20 prices, right? When we calculated the average, we also divided by 20! So why do we have to divide by one less, by 19, at the end of the calculation? Well, this is an exciting point. Subtracting one in the last step is a correction applied when calculating sample variance and standard deviation in statistics. It’s known as Bessel’s correction and involves using n – 1 instead of n (number of observations).
The square root of 0.000004422215 is 0.002102906.
We convert the number 0.002102906 into a percentage form (or multiply by 100 if that’s easier for you) and get 0.2103%. This means that the pair’s historical volatility based on twenty closing prices was 0.2103%.
Now, let’s calculate currency volatility in monetary terms:
At the end of the trading day on July 21, 2024, the EURUSD price was 1.0898, and a volatility of 0.2103% translates to a potential price increase or decrease by the end of the next day of 1.0898 * 0.2103% = 0.0023.
So, the upper bound is 1.0898 + 0.0023 = 1.0921, or the lower bound is 1.0898 – 0.0023 = 1.0875.
This gives us an estimated price range for the end of tomorrow: 1.0921 / 1.0875. The initial table shows that the closing price on July 22, 2023, was 1.0888, which is within the estimated range. It didn’t hit the exact calculated values, but it’s close.
Bottom Line
Therefore, when applied to the price, the currency pair’s volatility can show you how far to set your stop losses. However, they may still need to be suitable for you, as the levels with high volatility values can be too far away. It means that your deposit could disappear before your SL triggers.
If the market prices move far beyond the calculated levels, it signals that some event has occurred, causing the price to move outside its typical range. This means you should review your trading strategy, which might need adjusting. Something may be happening in the market; large traders are uncertain, and the current trend could accelerate or reverse.
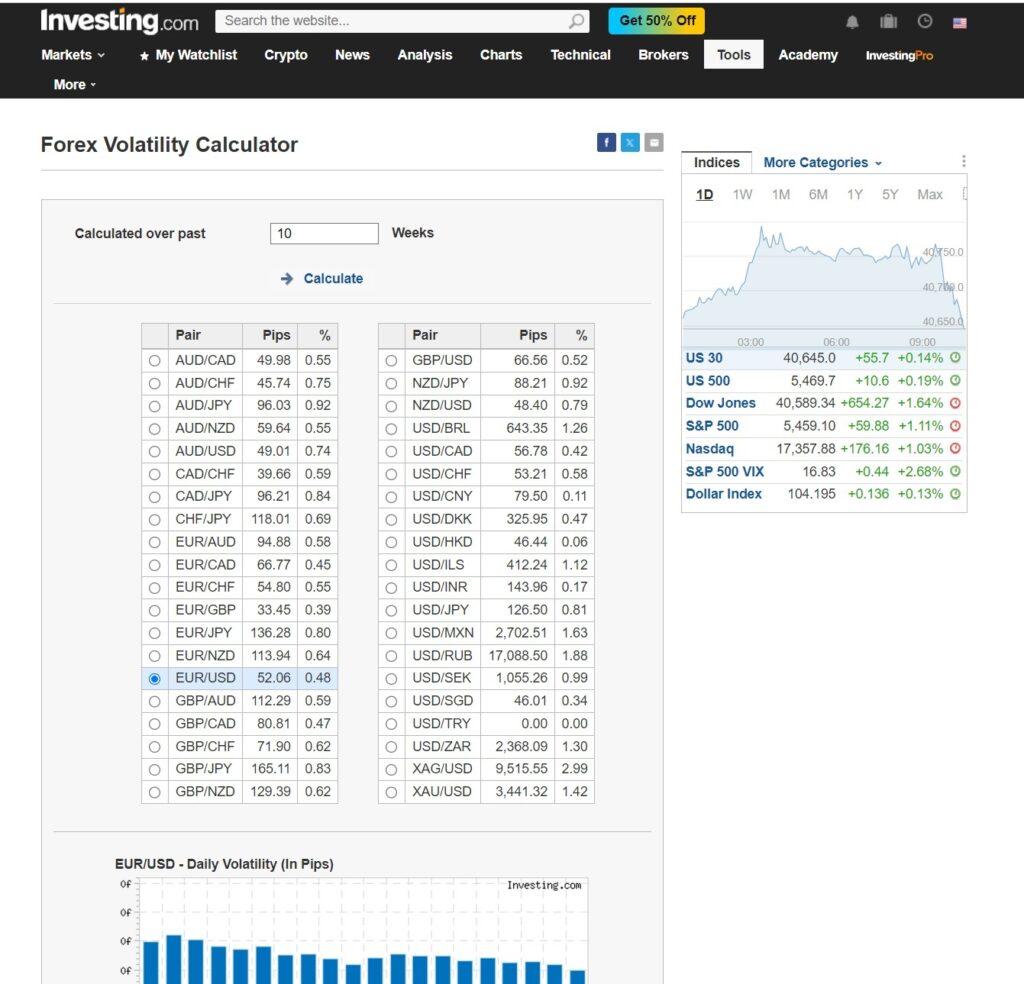
Of course, there have been “volatility calculators” on the web for a long time, so you no longer have to do the calculations. You can use ready-made calculations. We have just explained how these numbers are calculated and how to use the volatility of currency pairs in your trading. Here’s an example of such a volatility calculator:
But that’s not all about volatility. More to come.
We hope the information we provided was helpful.
DISCLAIMER! The Contracts for Difference (CFDs) we discussed come with high risks, and you could lose all the money you invest. Make sure you understand all the risks involved before you dive in.