
Today's article is about getting savvy with the forex market, specifically mastering trading with support and resistance levels. Whether you're just starting or looking to polish your trading tactics, we've got a step-by-step guide that will make things a whole lot clearer. We're even throwing in a real-deal example with gold trading to show you how it's done. We'll walk you through drawing those all-important lines on your charts and show you some neat tricks with scripts to make your life easier. So, come along as we explore how to sidestep the common traps and ride the waves to profit land. We promise you'll finish this read feeling more equipped and confident in your trading game!
Understanding Support and Resistance Level
Support is a price level where a downtrend can be expected to pause due to a demand concentration. As the price of a currency pair drops, demand for the buying opportunity increases, forming the support line. It’s seen as a “floor” where the price struggles to fall below. Conversely, resistance is a price level where a trend can pause or reverse due to a concentration of selling. As the price of a currency pair rises, sellers begin to outnumber buyers, forming the resistance line. It acts as a “ceiling” that prices struggle to break through.
Trading support and resistance levels is a foundational strategy in the forex and other financial markets. These levels are based on the concept that prices tend to pause or change direction when they reach certain predetermined levels, which are determined by past price actions. Learn to use these levels for more effective forex trading.
April 20, 2024 – gold
Trading support and resistance levels can be conventionally divided into two types:
- Horizontal support and resistance levels – these form levels.
- Sloping support and resistance levels – these form price channels.
Drawing these levels is a relatively straightforward task:
In the first case, the media often discusses levels as “psychological price levels.” The current “psychological levels” for Bitcoin are at around USD 70k (resistance) and at about USD 65k (support).
The second option involving channels is more complex. Here, as in the previous case, there is a lot of subjective assessment. You construct the channels, relying on your subjective interpretation of price charts. Alternatively, you can also use scripts that do this for you. Ready-to-use scripts for drawing support and resistance levels are readily available online on platforms like MQL5. Alternatively, you can find a programmer on that very same platform that will create a custom script according to your specific requirements. But remember, any script is just as good at building channels as the person who wrote it.
The principle for drawing all lines is the same. For instance, traders usually place support and resistance levels at points on the price charts where prices have frequently consolidated during corrections or where the lines conveniently align with the highs and lows of the opening and closing prices. We prefer to draw them on higher time frame charts (e.g., H4), which is generally sufficient for medium-term trading. This generally suffices for medium-term trading, but you should also pay attention to other timeframes, as they can sometimes be quite interesting. Also, we prefer to build lines not based on the candlestick shadows but on their bodies. Why? Because shadows tend to give too much variance from the actual trading ranges.
Real World Example of Trading Support and Resistance Levels
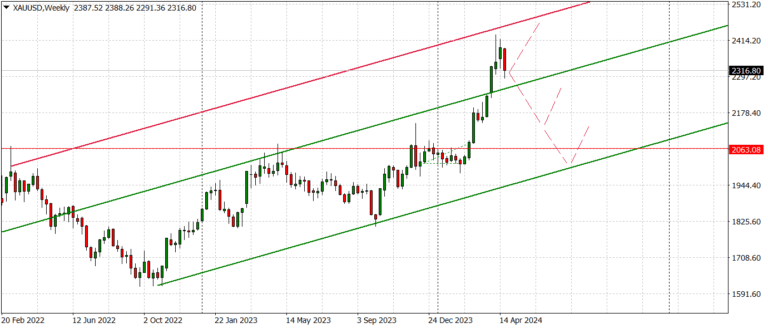
Now, let us examine a real-world example of how to trade support and resistance levels. In the image above, we have drawn lines on the XAUUSD gold chart. The time period is Weekly, meaning each candlestick shows the price change for one week. Therefore, the chart covers the price changes for approximately two years.
So, against the backdrop of missile strikes, the price of gold has risen, but it is evident that the prices have not reached the next barrier—the sloping red line of the new channel. From this, a scenario for trading or investing could unfold in the following way.
Right now, the gold price is inside a new channel. In such conditions, it is recommended to wait either for the prices to rise to the red resistance line at the top or to drop to the level of the green support line at the bottom. If prices drop below the support line, the target will be the middle of the green channel. If prices drop even lower, then the target is the very bottom line of the green channel. We would prefer to see prices decrease, as this would be a consequence of reduced tensions worldwide, but unfortunately, peace is not likely to occur globally anytime soon.
Therefore, we lean towards the following:
If you really want to open a trade right now, then:
1) Open a Sell order at the current price (now 2,314.87) aiming first for TakeProfit_1=2,287 and then for TakeProfit_2=2,138.
2) Set a stop loss for this order at approximately StopLoss=2,348.
This is a long-term plan.
The potential profit for one standard lot trade is:
1) (2,314.87 – 2,287) * 1 * 100 = $2,787.
2) (2,314.87 – 2,138) * 1 * 100 = $17,687
Possible losses for one standard lot trade size: (2,314.87 – 2,348) * 1 * 100 = -$3,313
As you can see, the potential loss is higher than the profit from achieving the first profit target. That’s why we recommend refraining from trading. However, if you are willing to take the risk, then go ahead and open the trade.
An option for those who expect further escalation between Israel and Iran could be to open a Buy trade with the goal of anticipating an increase in the price of gold to 2,484 and higher, with a stop loss at 2,247.
Potential profit for one lot: (2,484 – 2,314.87) * 1 * 100 = $16,913
Possible losses for one lot: (2,314.87 – 2,247) * 1 * 100 = -$6,787
The profit to loss ratio is approximately 1:2.5, which is a good proportion.
Plan for Trading Support and Resistance Levels
A trading plan focused on support and resistance levels can be a game-changer in navigating the forex market. Here’s a simple yet effective strategy to get you started:
We can create a trading plan and divide it into following scenarios:
- a scenario for movement within the channel,
- scenarios for reaching the channel’s upper or lower boundaries,
- scenarios for breaking out of the channel.
Almost all analysts construct similar plans, always considering upward and downward movement options. And by the way, if you’ve noticed, they never say which direction a currency pair will go. They always indicate two directions at once. There’s even a joke about it:
Furious after a loss, a trader enters an elevator, followed by an analyst running after him. The trader grabs the analyst by the collar and demands, “Will you finally tell me, for once, whether it will go up or down?”
So, to avoid being angry and irritable and keep everything under control, you need to think through your trading plan in such a way that all possible price movement scenarios in both directions are considered. The advantage of such a plan is that you always know your maximum loss if the scenario goes toward a loss for you. This is the best way to trade for your peace of mind. You methodically outline your plan and calculate risks. Then, you place your market and pending orders and always know the size of your potential win or loss. Then, you record the plan in your “trader’s diary.” You can keep it in Excel or buy a paper one or whatever floats your boat. And this goes to trading in general not just to trading support and resistance levels.
Remember, before opening a trade, you are one person, a sort of Mr. Jekyll, but after opening the order, you’re no longer that prudent individual; rather, you become Mr. Hyde. That’s why you must put your plan in place before trading to keep your inner Hyde in check.
In our previous article we reviewed trading different high-impact news events . Next time, we will examine trade execution during extreme volatility when the price gaps up or down.
Happy trading, everyone!
DISCLAIMER! The contracts for difference (CFDs) we discuss come with high risks, and you could lose all the money you put in. Make sure you understand all the risks involved before you dive in.
Do The Smart Thing. Subscribe!
Get notified about our new articles and insights.