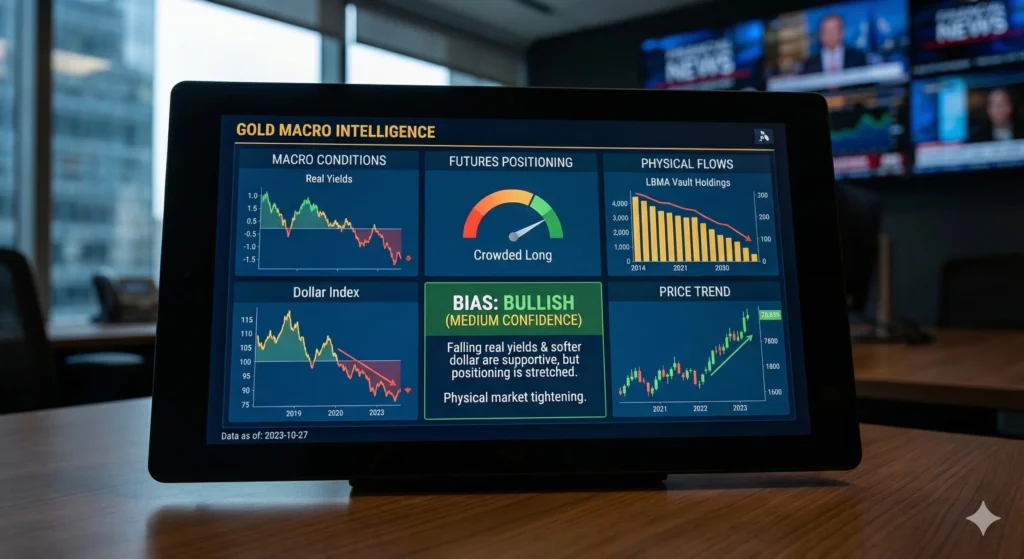
This article is a practical framework for forming a gold market outlook that stays grounded in observable data, without pretending you can forecast the next tick. It is also the same structure behind the Gold Intelligence Dashboard we have been building: a rules-based tool that aggregates the major drivers into a single bias (bullish, neutral, bearish) with a confidence assessment, and a plain-English explanation for why.
If you search for a gold market outlook, you will find no shortage of hot takes. One day gold is “all about inflation.” The next day it is “all about the dollar.” Then a CPI print hits, yields jump, and gold does the opposite of what a confident headline promised.
Part of the problem is that gold does not trade on one driver. It trades at the intersection of macro conditions, investor positioning, physical availability, and its own price behavior. That mix can shift quickly, and some inputs update daily while others update weekly or monthly. When you treat everything as if it updates in real time, you end up confusing “no new data” with “no new information,” and your outlook on gold becomes a reflection of your feed rather than the market.
Why a gold market outlook is harder than it looks
Gold sits in a strange place in the financial ecosystem. It behaves like a currency when real yields change, like a risk hedge when confidence wobbles, and like a commodity when physical flows tighten or loosen. It can rise while stocks rise, fall while stocks fall, or ignore both. That is not because gold is “random.” It is because different participants dominate at different times, and their constraints are not the same.
A macro trader might care about real rates and the dollar. A futures trader might care about positioning, liquidity, and volatility. A physical market participant might care about inventory and financing conditions. A long-only allocator might care about drawdowns and correlation. All of them can be right about their slice of reality and still wrong about what price does next, because the marginal buyer changes.
So instead of asking “what is gold about today,” it is often better to ask “which driver currently has the cleanest signal, and do the other drivers confirm or conflict.” That one shift improves decision quality more than adding another indicator ever will.
The four-driver framework behind a useful outlook on gold
A practical outlook on gold can be built from four buckets. The goal is not to predict, but to classify the backdrop.
Macro conditions is where real yields, the dollar, and broader liquidity live. In plain terms, gold tends to like falling real yields and a softer dollar, and it tends to struggle when real yields are rising sharply and the dollar is ripping. “Tends to” is doing honest work here. The relationship is not perfect, but it is one of the most reliable starting points.
Positioning is the futures market crowding story, commonly read through the CFTC Commitment of Traders report. Positioning tells you whether speculative money is already heavily committed in one direction. When a trade gets crowded, it can continue for a while, but it becomes fragile. In practice, extreme longs can reduce upside surprise, and extreme shorts can set up powerful squeezes.
Physical flows is where you look for evidence that metal is being absorbed or released, often visible in vault holdings. The LBMA London vault data is one way to keep an eye on that. Physical data moves slowly, but that is the point. When physical conditions are tightening or loosening, it can matter even when the headlines are focused elsewhere.
Price trend. This is the market’s own vote. Price contains information about what the collective is willing to pay. You do not need a complicated technical system to respect it. A simple view of momentum and overbought or oversold conditions can tell you whether price action is confirming the macro story or fighting it.
A strong gold market outlook is usually the one where these buckets line up, or where you can clearly explain why they do not.
Start with macro gold market outlook, but do not stop there
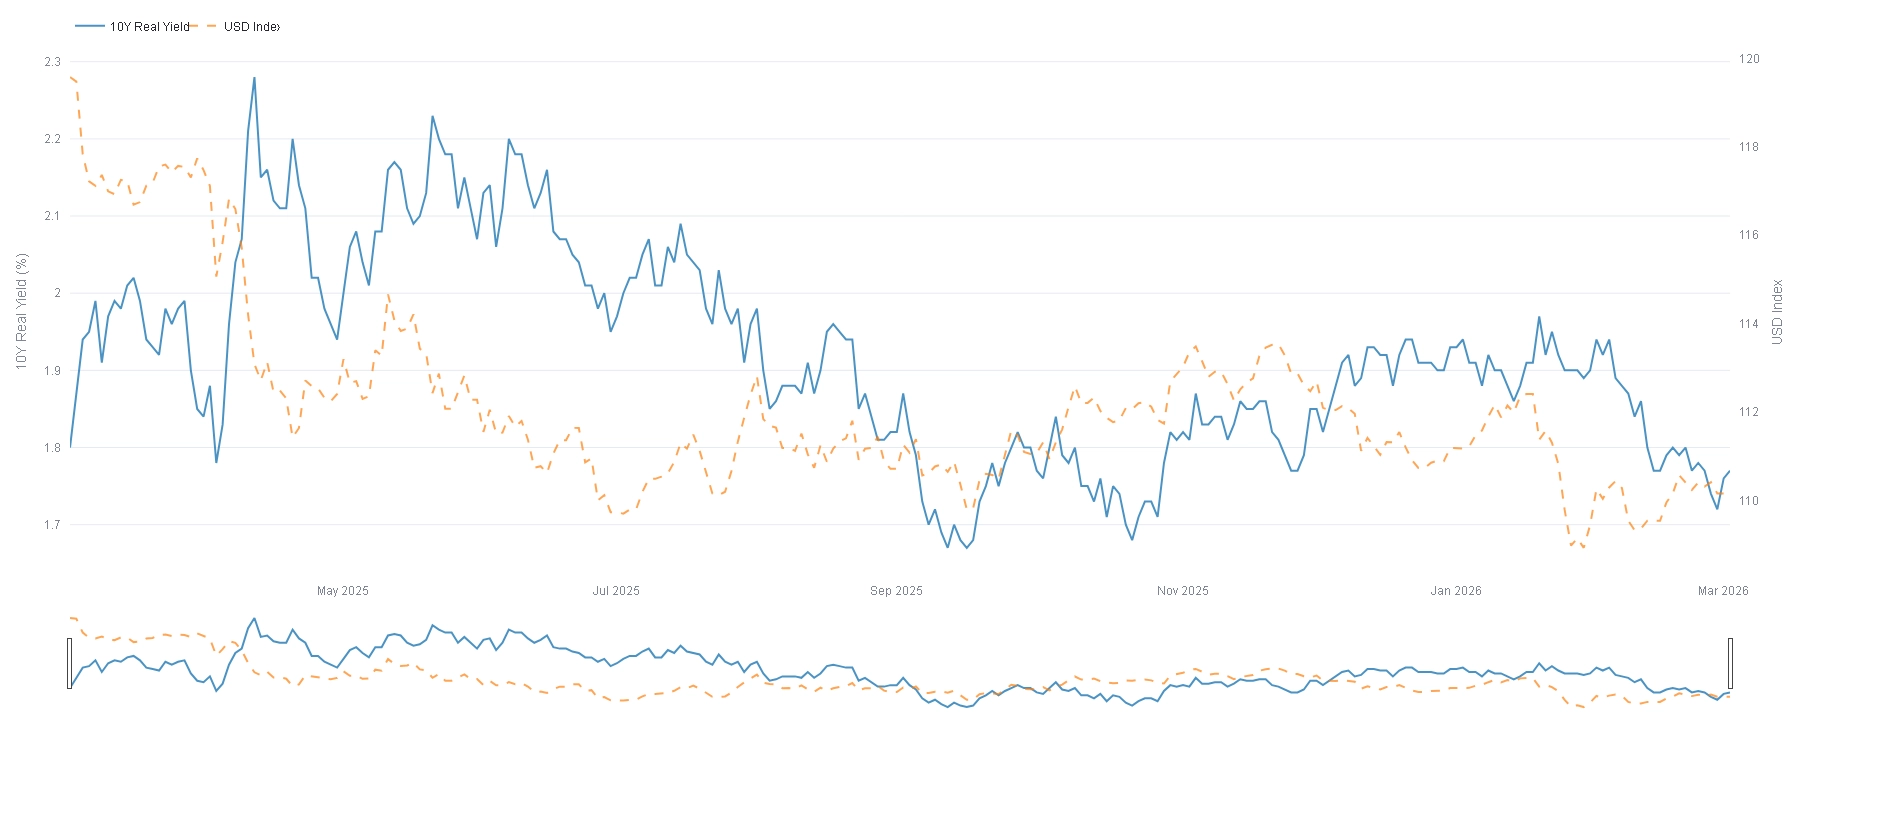
Most people begin their outlook on gold with yields and the dollar, and that is reasonable. Gold is often described as a zero-yield asset, so when real yields rise, holding gold becomes more expensive in opportunity cost terms. When the dollar strengthens, it can mechanically tighten financial conditions and make gold more expensive for non-dollar buyers.
What matters is not the level of yields in isolation, but the direction and the speed of change. A slow grind higher in yields might be digestible. A sharp repricing can force repositioning across portfolios, and gold can react more violently.
The same goes for the dollar. A mild dollar bid might not matter. A broad, persistent dollar surge that tightens global dollar funding can matter a lot. If you want a cleaner macro read, focus on the trend rather than a single print. One good habit is to compare the last few weeks to the prior few months. That is often enough to separate “noise” from “shift.”
Still, macro alone is not a complete gold market outlook. Macro can be supportive while gold goes nowhere because positioning is already stretched and buyers are exhausted. Macro can be hostile while gold holds up because the market is de-risking and wants insurance. Which brings us to positioning.
Use positioning to gauge fragility, not to call tops every week
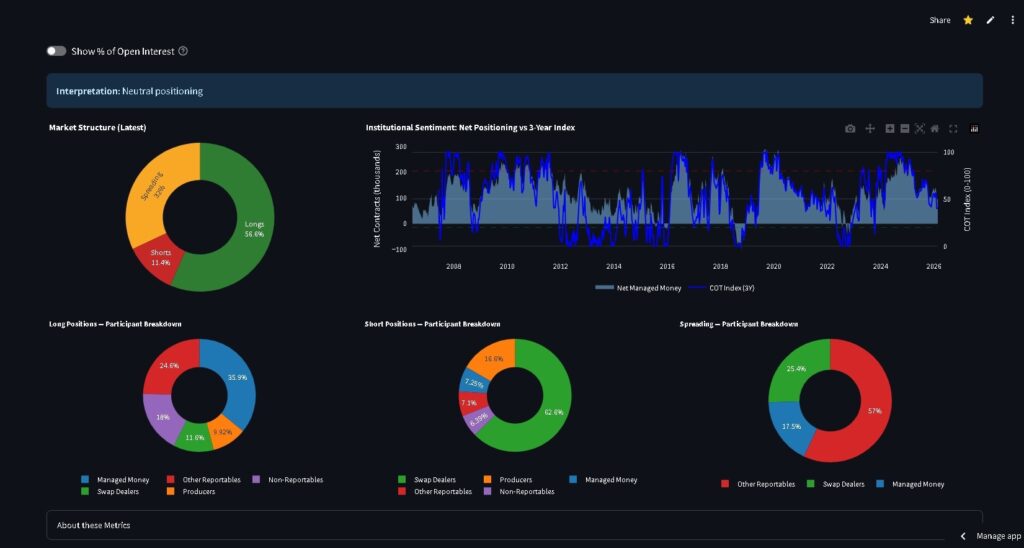
The COT report is not a day-trading tool. It is a weekly snapshot, released on Fridays, reflecting Tuesday positions. That gap matters. If you treat it like a live feed, you will misuse it.
Where COT shines is in answering a different question: is the current narrative already widely owned? If speculators are heavily net long relative to their own history, you should assume that a lot of bullishness has been expressed through futures. That does not mean gold must fall. It means the rally may need fresh fuel to continue, and any disappointment can trigger a sharper shakeout.
If speculators are unusually net short, the opposite can be true. It can signal pessimism that is already priced in, setting up a reversal if macro conditions improve even slightly.
This is also where confidence comes from. When macro is bullish but positioning is already extreme, a reasonable outlook on gold can still be bullish, but your confidence should be lower. The market may be right, but it is also crowded.
Physical data is slow, and that is why it is useful
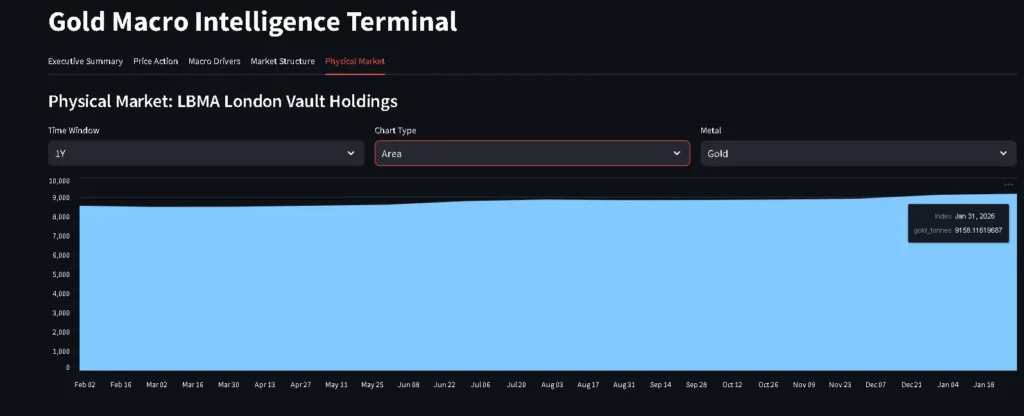
LBMA vault holdings data is published monthly, typically on the fifth business day, and it reflects month-end holdings. That lag is not a flaw. It is a feature. It forces you to treat physical flows as a backdrop, not a trading signal.
Physical data helps answer questions like: are inventories trending higher, suggesting supply is building, or trending lower, suggesting metal is being absorbed? Those trends can align with ETF flows, central bank behavior, and broader demand dynamics, but you do not need to overcomplicate it. Over time, persistent drawdowns or rebuilds tend to matter.
In a practical outlook on gold, physical is often the tie-breaker. If macro and positioning are mixed, and physical trends point clearly in one direction, it can tilt your bias. If physical is stable, it might simply lower the urgency of your view.
Price trend keeps you honest
You can be right on macro and still be early. Price trend is the simplest way to avoid being stubborn. If gold is making higher highs and holding pullbacks, that is information. If gold repeatedly fails at a level while macro looks supportive, that is also information.
A common mistake is to treat “technicals” as a separate religion. You do not need that. A basic momentum measure and a simple overbought or oversold gauge can be enough to avoid the worst errors.
For example, if your gold market outlook is bullish because real yields are falling and the dollar is softening, but price momentum is rolling over and the market is failing to follow through, you should at least consider the possibility that something else is offsetting your macro thesis. Often that “something else” is positioning, or a shift in risk appetite, or simply a market that has already moved and is waiting for the next catalyst.
Putting it together: bias, confidence, and a plain-English explanation
This is where most market commentary fails. It gives a direction without telling you what would change the view, or it throws ten indicators at you and calls it “analysis.”
A better approach is to be explicit. Your outlook on gold should state three things clearly.
First, what is the bias right now, given the weight of the evidence. Second, how confident are you, given whether the drivers align or conflict. Third, what is the short explanation, in normal language, that connects the inputs to the output.
That third part sounds obvious, but it is surprisingly rare. It is also the part that builds trust, because it forces you to say what you are actually relying on. “Bullish because real yields are falling, the dollar trend is softer, and price momentum confirms, but confidence is only medium because speculative longs are crowded and physical flows are not clearly tightening.” That is an outlook on gold a real human can audit.
This is exactly why we built our dashboard in a deterministic-first way. The point is not to produce a mysterious score. The point is to produce a readable gold market outlook that can be checked, debated, and improved, while still being usable in real time.
A note on data freshness, so you do not fool yourself
One of the most underrated parts of good analysis is simply labeling what is fresh and what is not. Daily macro series may be delayed a day or two. COT is weekly. LBMA is monthly. If you run a dashboard and hit refresh ten times, you do not get ten new data points. You get the same last published point, plus your own anxiety.
Any tool that shows these series should display the “as-of” date prominently. When there is no new publication, the correct interpretation is often “unchanged because no new data,” not “broken.” This seems small, but it prevents a lot of bad decisions.
The takeaway
A gold market outlook does not need to be complicated, but it does need to be structured. Macro tells you the broad opportunity cost and currency backdrop. Positioning tells you how fragile the trade is. Physical trends tell you whether the slow-moving supply and demand picture is tightening or loosening. Price trend tells you what the market is actually doing with all of the above.
If you want to use this framework consistently, we have packaged it into the Gold Intelligence Dashboard, which outputs a deterministic bias, a confidence read, and a clear explanation tied to the four drivers. If you are interested in seeing it in action, the simplest next step is to follow the project updates on our blog. We will be sharing examples of weekly outlooks on gold using the exact same rules, so you can judge whether the approach earns your attention.