Economic cycles shape the rhythm of financial markets. They drive shifts in currency values, investment strategies, and business decisions. In our article, we will take you through the stages of a business cycle. We will explain how they influence economies and send ripples across the financial landscape. We’ll review the essential indicators that may signal shifts in the cycle and help investors, business owners, and market enthusiasts to make more informed decisions.
What Is the Business Cycle?
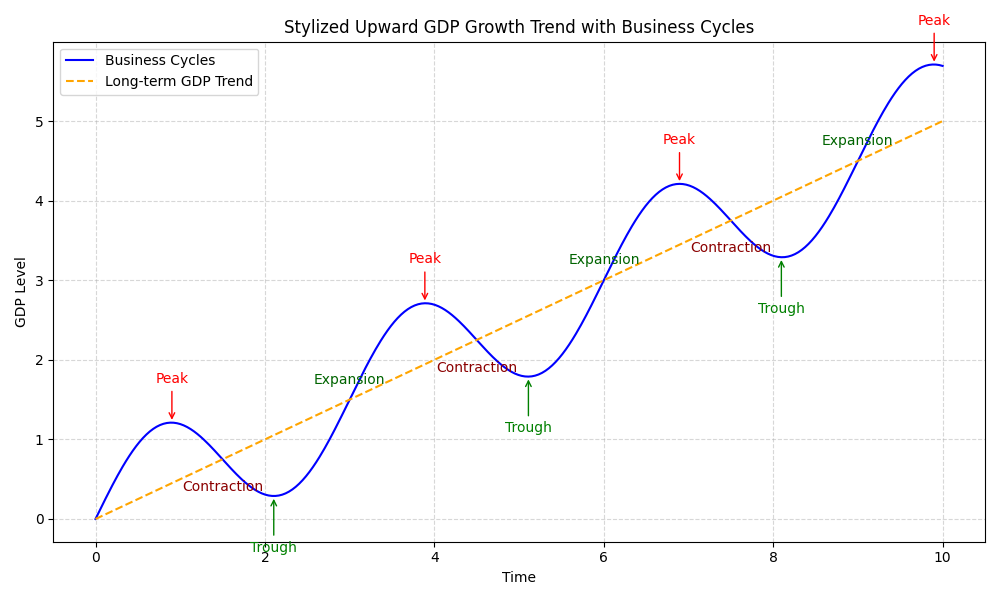
In economics, change is constant. Rather than steady, uninterrupted growth, economies experience cyclical upswings and downswings. Think of the economy like the changing seasons. Spring brings fresh growth and blossoming, just as an economy experiences expansion. Summer’s warmth and stability mirror an economic peak. Autumn’s decline into winter parallels contraction and, eventually, an economic trough. This is what we call the business cycle (or economic cycle). Now, let us explore them in more detail.

Economic Expansion
First, we encounter the phase known as economic expansion. During this phase, the economy is on an upward trend and growing. In practical terms, this means more goods and services are being produced, more jobs are available, and overall business activity is increasing. As a result, businesses typically thrive, unemployment decreases, and the country’s total income, known as Gross Domestic Product (GDP), rises. As this happens, consumer confidence grows, leading to increased spending.
How Do Financial Markets Behave During This Stage of the Business Cycle?
Inflation is minimal at the start of an expansion; interest rates are often still low. Why “still” low? Because they remain at reduced levels from the previous recession. Central banks typically respond when an economy enters a recession by lowering interest rates to make borrowing cheaper. The economists call this “Expansionary Fiscal Policy.” This policy aims to stimulate economic activity and jumpstart a lagging economy.
EXAMPLE: The COVID-19 Pandemic caused a sharp global recession in 2020. To combat this, central banks worldwide, including the US Federal Reserve, the European Central Bank, and the Bank of England, slashed interest rates to near zero and implemented other measures like quantitative easing (buying assets to inject money into the economy).
As the economy transitions into the expansion phase, interest rates may remain relatively low for some time. The goal is to encourage businesses and consumers to borrow and spend, effectively restarting the economic cycle.
What does this mean for financial markets? Low interest rates exert downward pressure on currency values, as lower yields make the currency less attractive to foreign investors. At the same time, the wave of general optimism during an expansion often fuels stock market growth. Investors tend to shift out of low-risk assets, like government bonds, and move into riskier assets, such as equities, in pursuit of higher returns.
Towards the end of the expansion phase, the economy shows the first signs of overheating, such as an increase in inflationary pressures. This is when central banks gradually begin to consider raising interest rates.
Peak of the Business Cycle
As the saying goes, “What goes up must come down.” After the climb, the economy reaches its highest point, known as the peak of the business cycle. At this stage, the economy is at its strongest, with production, employment, and income at their highest levels. However, the peak signals a turning point; the economy cannot indefinitely remain at its maximum output. This stage marks the transition from economic expansion to contraction.
The economy may appear robust at this stage, but the peak also serves as a critical turning point. No economy can sustain maximum output indefinitely. The forces driving the expansion (e.g., rising consumer spending, increased borrowing, and growing business investments) often begin to strain available resources.
What Happens at the Peak?
Demand for goods and services may outpace supply, leading to rising prices. Inflation typically reaches its highest levels during this phase. Employment is at its highest, which can result in wage growth as businesses compete for talent. While this benefits workers, higher labor costs may squeeze company profit margins.
Central banks often raise interest rates to combat inflation and prevent the economy from overheating. This action makes borrowing more expensive for businesses and consumers, which can slow down spending and investment.
How Does the Peak Impact Financial Markets?
For financial markets, the peak often brings mixed signals. On one hand, corporate profits might still be strong, and stock markets may continue to climb as optimism persists. On the other hand, signs of an impending slowdown, such as higher interest rates or decreased consumer spending, can make investors cautious.
Investors may start to reevaluate high-risk investments, leading to increased market volatility. Stocks, particularly in cyclical industries like real estate, retail, and manufacturing, may face downward pressure as the economy starts to cool.
Rising interest rates typically result in falling bond prices. However, for risk-averse investors, government bonds can become a safer haven as the economy transitions toward contraction.
Strong economic performance can keep a currency stable or even strengthen it. However, speculative movements in forex markets may occur as inflation concerns mount and central banks raise interest rates, which creates upward pressure on currencies.
Higher interest rates often attract foreign capital as investors seek better returns, creating upward pressure on the currency’s value. At the same time, anticipating these rate hikes can lead to speculative movements in forex markets. Traders might buy the currency expecting appreciation, further driving its value upward. This interplay highlights how central bank actions and market sentiment can amplify currency fluctuations during periods of strong economic performance.
The Transition to Contraction
The peak is not sustainable because economies are dynamic systems. When inflation rises too high or businesses struggle to maintain profits due to rising costs, cracks form in the foundation of economic growth. Consumers may scale back spending, and businesses may cut investments or lay off workers to reduce costs. This phase marks the shift from economic expansion to contraction, signaling the start of a downturn.
Real-Life Example:
The financial crisis of 2008 provides a stark illustration of a peak leading to contraction. Leading up to the crisis, the global economy expanded, with booming housing markets, record corporate profits, and low unemployment. However, as housing prices reached unsustainable levels and inflationary pressures grew, the peak was reached, and the subsequent contraction triggered a severe global recession.
While the peak represents the height of economic activity, it is also a warning sign of change, which everyone tends to ignore as it unfolds.
Contraction Stage
After the peak, the economy enters a period of decline known as the contraction stage or recessionary phase. This stage represents a downturn in the business cycle, where economic activity slows and growth decelerates significantly. Indicators that were previously on an upward trajectory, such as production, employment, and consumer spending, begin to reverse.
In practical terms, fewer goods and services are produced, and businesses often cut back on operations to adjust to reduced demand. Job opportunities shrink, increasing unemployment as companies streamline their workforces to control costs. This phase brings tougher conditions for businesses, with many struggling to maintain profitability. Some may face financial distress or even bankruptcy, especially in industries susceptible to economic cycles (e.g., retail sales, hospitality).
The optimism that characterized the peak phase quickly dissipated, replaced by growing concerns about the economy’s future. As consumer confidence wanes, they reduce spending, further dampening business revenues and economic activity.
What Happens in the Retail and Manufacturing Sectors?
Sales typically decline as households prioritize essential spending and cut back on discretionary purchases. This reduction in consumer demand leads to growing inventory stockpiles as products remain unsold. These stockpiles are a warning sign, often signaling that the economy is heading for deeper contraction.
Slowing production and reduced new orders are common during this phase in the Manufacturing Sector. Companies may delay or cancel plans for expansion as they grapple with shrinking markets and rising costs.
Leading Indicators of Economic Contraction
Several key indicators warn early about an economic downturn during the contraction stage. For instance, as businesses reduce staff, the unemployment rate climbs. Surveys like the Consumer Confidence Index reflect declining optimism about the economy, often leading to lower spending. Companies may postpone significant capital expenditures, such as new factories, equipment, or technology, in anticipation of slower growth. Declines in factory production and new orders often highlight weakening demand.
How Does the Contraction Phase Affect Financial Markets?
Financial markets tend to react strongly to signs of contraction. Stock markets often experience significant declines during this phase. Investors pull out of riskier assets as corporate earnings shrink and economic uncertainty grows.
Government bonds typically become more attractive during a contraction. Bond prices often rise as interest rates fall in response to slowing growth, offering a haven for risk-averse investors. Economies in contraction may see their currencies weaken, particularly if central banks implement rate cuts or other monetary easing measures to stimulate growth.
How Do Policymakers Respond?
Central banks and governments often intervene with measures to stabilize the economy to mitigate the effects of this business cycle stage. Central banks may lower interest rates to encourage borrowing and investment. Additionally, they may deploy tools like quantitative easing to inject liquidity into the economy. Governments may increase public spending, such as infrastructure projects or direct financial aid, to support employment and stimulate demand.
Example: The 2008 Financial Crisis
The global financial crisis of 2008 serves as a clear example of the contraction phase. After the housing market collapsed, consumer spending plummeted, and businesses faced widespread losses. Unemployment soared, and the global economy entered one of the deepest recessions in modern history. In response, central banks worldwide implemented aggressive interest rate cuts and large-scale stimulus packages to stabilize the economy.
The Trough
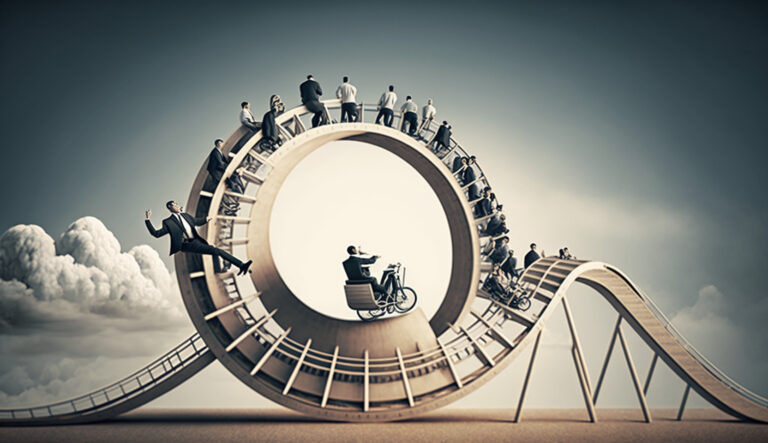
In the trough, the economy reaches its lowest point, marking the end of its downward slide. This stage represents the turning point in the business cycle, where the decline halts and the potential for recovery begins. From here, the economy is expected to start improving, eventually entering the next growth phase. It’s much like a roller coaster: after the steep descent, the climb begins anew.
How Long Does the Trough Last?
The duration of a trough can vary widely. Some economies rebound quickly, while others may experience a prolonged period of stagnation before growth resumes. The length of the trough depends on several factors.
For instance, governments and central banks play a crucial role in determining how quickly an economy can recover. Stimulus measures, such as interest rate cuts, fiscal spending, and monetary easing, can help accelerate recovery.
Events like geopolitical conflicts, global supply chain disruptions, or pandemics can prolong a trough by delaying economic recovery. Economies facing deep-rooted structural issues, such as outdated industries or severe income inequality, may struggle to rebound quickly.
While there is no fixed timeline for the duration of this business cycle stage, it is characterized by a gradual stabilization of economic indicators. Signs of recovery, such as a slowing in job losses or increased consumer spending, often emerge during this phase.
What Does the Trough Mean for Financial Markets?
The trough is a time of uncertainty for financial markets, but it also presents opportunities. During a trough, stock markets may reach their lowest levels, creating opportunities for investors willing to take risks. As the economy begins to stabilize, early investors often see significant returns as stock prices recover.
Government bonds are typically attractive during this phase, offering a safe haven for investors. With interest rates often at their lowest, bond prices are usually high. Currencies of economies in a trough may face downward pressure, especially if central banks have aggressively lowered interest rates. However, as recovery begins, currency stability often returns.
Examples of Economic Troughs
One of the most notable examples of a trough is the Great Depression of the 1930s. After years of economic decline, the global economy finally bottomed out in the early 1930s. Recovery was slow and required significant intervention, including the New Deal policies in the United States.
Another more recent example is the COVID-19 pandemic-induced trough in 2020. Following the sharp contraction caused by lockdowns and reduced global activity, economies worldwide experienced a trough characterized by high unemployment and decreased production. However, aggressive fiscal policies helped many economies recover relatively quickly.
While challenging, the trough is a necessary part of the business cycle. It allows for correcting imbalances built up during the expansion and peak phases. Businesses adapt, inefficiencies are addressed, and the groundwork for future growth is laid.
How Do We Track the Business Cycle Stages?
Economists use several key indicators to determine the economic cycle’s progress. Let’s quickly cover the most popular metrics. The total value of goods and services produced in a country is called the gross Domestic Product (GDP). When GDP grows, the economy expands. A decline signals a slowdown or recession.
Improving Employment Data means growth while increasing unemployment suggests economic trouble. Industrial Production measures how much is produced in factories, mines, and utilities. Growth in production points to expansion, while declines suggest contraction. Higher consumer spending or the other side of this coin — retail sales indicate growth while falling sales often precede slowdowns.
Rapidly rising prices (inflation) can signal the peak of a cycle, while low inflation might indicate a slowdown. Falling interest rates are usually linked to economic slowdowns, while rising rates often accompany growth.
Strong Stock Market Performance suggests growth, while sustained declines can point to a slowdown.
High sales in the housing market and rising prices indicate growth; low sales and falling prices suggest contraction.
Organizations like the National Bureau of Economic Research (NBER) analyze these indicators to determine where we are in the cycle. However, these signals can sometimes conflict, and initial data may be revised later.
A WORD OF CAUTION: all these indicators are not an exact science and can sometimes send “mixed signals,” if you know what we mean. 🙂 That’s why you shouldn’t base your trading and/or investment decisions on any single indicator but instead use a combination for a more comprehensive view.
We have a detailed article on this topic. Feel free to check it out.
CONCLUSIONS
The business cycle affects every part of the economy, from jobs and production to financial markets. Each phase—expansion, peak, contraction, and trough—comes with its challenges and opportunities. We can better understand where the economy is heading by tracking indicators like GDP, inflation, and employment. However, these signals are not always clear-cut, so relying on a mix of data is essential. Now that you understand the stages of a business cycle, hopefully, you’ll feel more confident making informed trading decisions. If you liked our article, please share it with your friends. Have questions or concerns? Drop us a comment in the section below!
Why Finansified?
Our expert team with decades of first-hand experience in the global Forex markets, Finansified have navigated the complexities and seized opportunities that many only hear about.
We can assist you with registration and licensing of your new Forex broker and Crypto Exchanges in various jurisdictions worldwide. We also specialize in creating and fine-tuning trading infrastructures from scratch. If you’re serious about maximizing your returns and mastering Forex, now is the time to take action.


