Getting a handle on trading can be tricky, especially when understanding price movements. One key detail that many traders miss is the concept of “ticks.” Ticks represent the smallest possible price change of a trading instrument, providing a detailed look at how prices fluctuate. Each tick records a trade or a price change, offering incredibly detailed price information. This data helps traders analyze market trends and develop strategies. Additionally, ticks are crucial for understanding the bid-ask spread, which can significantly influence trading decisions and lead to more accurate market analysis.
What Is a Tick in Trading
In trading, “ticks” represent a trading instrument’s smallest possible price movement, providing detailed data on price fluctuations. Each tick records a trade or price change, which is essential for high-frequency and algorithmic trading. Tick data includes the trade’s time, price, and volume, offering the most granular level of price information. Traders use this data to analyze market behavior, identify trends, and develop strategies. Tick charts display price movements per trade, unlike time-based charts. Additionally, ticks help understand the bid-ask spread, revealing how it changes over time and influencing trading decisions and strategies for more precise market analysis.
Using Ticks for Placement of Stop Loss and Take Profit Levels
Based on the statistics of customer inquiries (traders) in the customer support department of the brokerage where we worked, we concluded that many clients struggle with understanding how far to set StopLoss and TakeProfit levels. The problem is that MetaTrader builds charts only using the Bid. This fact causes difficulties for beginners in correctly setting StopLoss/TakeProfit orders. Inexperienced traders don’t take the spread into account.
Let’s put this into perspective. The average spread—the difference between buy and sell prices—for the EURUSD pair (also known as ‘Fiber’) is typically 0.00015 (or 1.5 pips)*, while for USDMXN (Mexican Peso), it’s 0.00471 (or 47.0 pips)*. That’s nearly 30 times larger than the spread for EUR/USD. Imagine a scenario where a trader overlooks this spread: the distance between the Ask and Bid prices. This oversight often leads to misplacement of StopLoss/TakeProfit orders, triggering them at the wrong time and place, contrary to the trader’s intentions.
* If your broker quotes to the fifth decimal place, the fifth digit is called a “pipette”, nevertheless some traders may refer to it as a pip and would calculate the spread as 15 and 470 pips =:). However, the calculation of profit and loss will still be based on the value of the fourth decimal place. Go figure 🙂
The result? Trade disputes, bad social media reviews, and facepalms from the broker’s employees investigating them. You wouldn’t believe how often this happens—it is by far one of the most frequent trade disputes.
Let’s consider the most common types of complaints that the client support team at our previous employer had to handle:
1. “My deferred BuyLimit order didn’t execute, even though the price on the chart was below the order level.”
2. “My Sell order was closed by StopLoss, but the prices on the chart didn’t reach the Stop level.”
In both cases, traders make a common mistake—they forget that order execution follows trading rules based on Ask prices. Meanwhile, the trading terminal builds charts using bid prices, but the ask price line isn’t shown (by default, but we can display it by changing the settings). Therefore, the orders were executed according to trading rules.
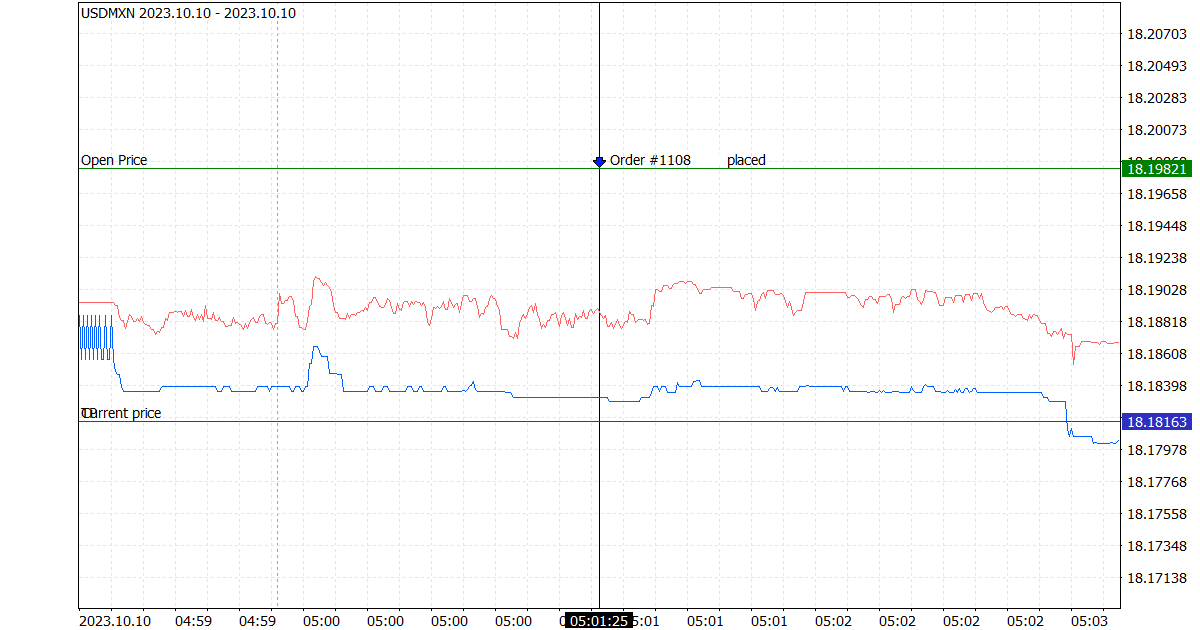
In the illustration below, we’ve provided an example of this situation:

In the image above, the blue line represents the Bid prices, the red line shows the Ask prices and the green line indicates the order opening level. As you can see, it’s crucial to consider the spread width since it can be quite broad. On the chart, you’ll only see the blue Bid line.
Using Ticks in Trading with Expert Advisors
It’s also helpful to record tick prices if you’re trading with trading robots, aka Expert Advisors. In addition to running your trading robot, we recommend that you record tick prices for the pairs you trade using another robot. These ticks can be useful if trade disputes arise regarding your order execution. In resolving such trade disputes, only the archive of tick prices and the trading terminal log will be the ultimate sources of information.
The trading terminal on the trader’s side only writes logs if a trader enables this feature, and the broker’s trading server side always does that. The log on the trading server side takes precedence in disputes. In the MT5 trading log, you can see both the closing Bid and Ask prices.
Additionally, recording the history of both Bid and Ask tick prices helps test your trading robots. The strategy tester will impute Ask prices during backtesting since the MetaTrader trading terminal doesn’t save Ask price history. This means in practice: when you run the strategy tester, the spread will be calculated once and then used as a constant for all subsequent ticks. Alternatively, you can input the spread manually, but it will remain constant, which doesn’t reflect actual trading conditions. Using archives of tick prices, you can fine-tune your trading robots more effectively than relying solely on Bid prices.
You can find an advisor or indicator with tick prices Search TickSave at MQL5.
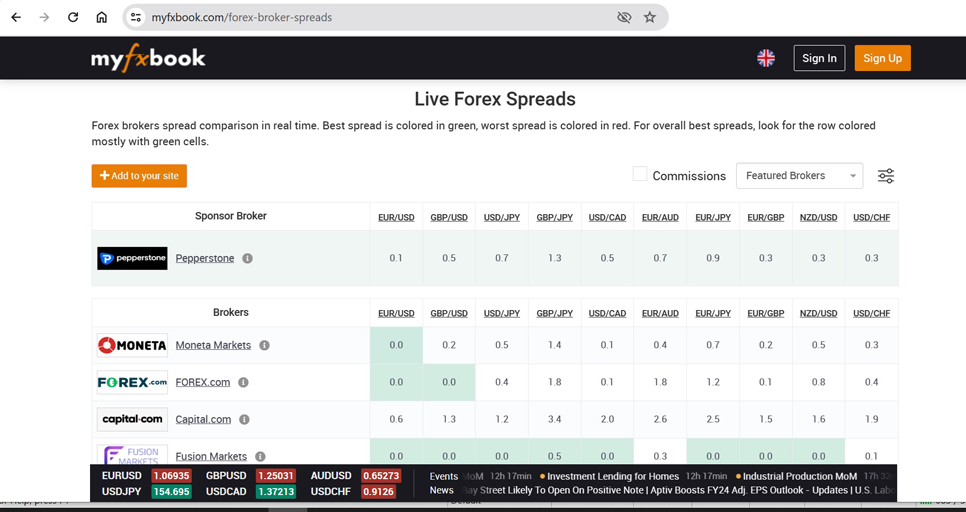
You can go here to choose a currency pair for your trading robot. This resource offers convenient filters for selecting and sorting data:

Last time, we looked at data feeds. Next time, we will discuss rollovers.
DISCLAIMER! The contracts for difference (CFDs) we discuss come with high risks, and you could lose all the money you put in. Make sure you understand all the risks involved before you dive in.
Unlock the wisdom of ‘Finansified’ Forex Market Industry Veterans. Follow us for proven FX trading insights, comprehensive market analysis, and strategies honed over years of first-hand experience in the global Forex industry.
Do The Smart Thing. Subscribe!
Get notified about our new articles and insights.


