
Cryptocurrency prices respond to a unique mix of crypto drivers: global economics, investor sentiment, technology, regulation, and sheer market mechanics. Unlike traditional assets, which hinge on metrics such as earnings or GDP, these cryptocurrency drivers often revolve around confidence, code upgrades, and liquidity conditions. This guide unpacks each driver and shows real-world episodes where they moved the market.
The Five Core Crypto Drivers You Need to Watch
Price action in digital assets often looks chaotic, yet five cryptocurrency drivers shape almost every rally, crash, or sideways grind. LIke we mentioned, these core crypto drivers are: global economics, investor sentiment, technology, regulation, and sheer market mechanics.
When Cheap Money Flows, Risk Assets Rise
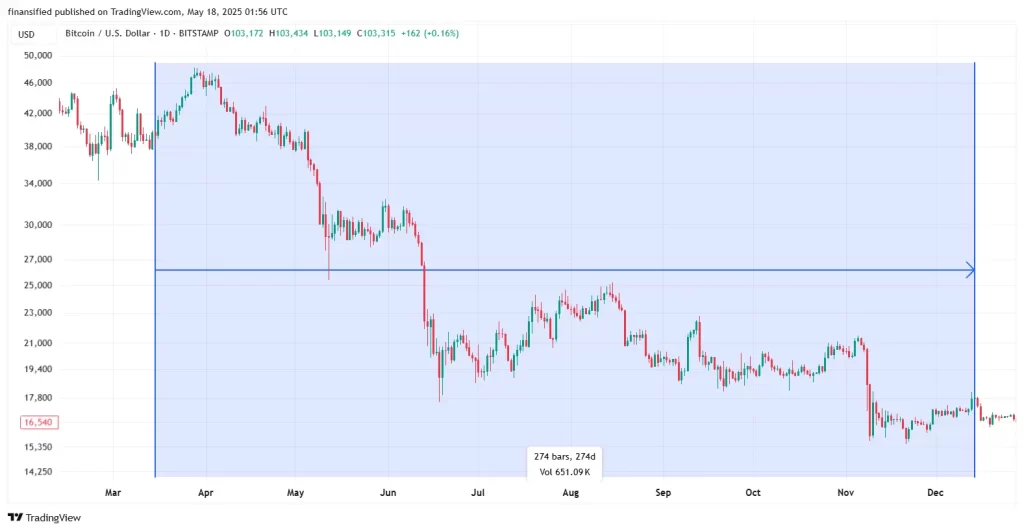
Central-bank policy sits at the heart of all crypto drivers. Loose monetary policy pumps cheap dollars into the system, sending investors hunting for yield across every asset class. For example, Bitcoin surged from $4,000 to nearly $70,000 between March 2020 and November 2021, a period marked by near-zero interest rates and record stimulus. Conversely, when the U.S. Federal Reserve started hiking rates aggressively in 2022, Bitcoin lost more than 70 % of its value (see the image below). Higher yields made cash and bonds attractive again, draining liquidity from risk assets.
In other words, watch central-bank meetings and global liquidity gauges. If real rates stay low or fall, the pro-risk backdrop supports higher crypto prices. If rates rise sharply, expect pressure on every other cryptocurrency driver.
Market Sentiment: Narratives Drive FOMO and FUD
Unlike stocks, crypto has no quarterly earnings calls. Instead, stories—whether bullish or bearish—move the market quickly. For example, social-media chatter, Google search trends, and headline news create a feedback loop of greed (FOMO) and fear (FUD).
- Positive sentiment example.
In early 2021, Elon Musk’s tweets about Dogecoin sent DOGE up 50% in hours. Optimism spilled into Ethereum and Bitcoin.
Dogecoin is the people’s crypto
— Elon Musk (@elonmusk) February 4, 2021
- Negative sentiment example.
Musk reversed course in May 2021, saying Tesla would halt BTC payments over environmental concerns. Within two weeks, Bitcoin plunged from $64,000 to $30,000.
Because sentiment swings are rapid, traders often monitor the Crypto Fear & Greed Index and real-time social-media dashboards to gauge this cryptocurrency driver.
Code Changes = Price Changes
Cryptocurrencies live inside software, so technical upgrades—or failures—directly affect value.
Upgrades That Lifted Prices
Ethereum’s EIP-1559 (Aug 2021) added a fee-burn that permanently removes ETH from supply. Ether rallied on the burn narrative. Under EIP-1559, each transaction includes a base fee. This base fee is burned, meaning it is sent to an address that is cryptographically inaccessible, effectively removing that amount of ETH from circulation permanently. As more transactions occur, more ETH is burned, reducing the total supply over time. This reduction in supply can potentially increase the value of ETH, assuming demand remains steady or increases.
The Merge (Sep 2022). Ethereum switched to proof-of-stake, cutting energy use by 99%. Although ETH dipped on a “sell the news” knee jerk, the upgrade improved long-term fundamentals.
Proof of Work (PoW) and Proof of Stake (PoS) are two primary consensus mechanisms used in blockchain networks to validate transactions and secure the system.
Failures That Crushed Prices
The DAO hack (2016): A smart-contract exploit wiped $60mn in ETH. Panic erased 30% of Ether’s market cap within hours.
Ronin bridge hack (2022): Hackers drained $600mn from Axie Infinity’s sidechain. AXS tumbled as trust disappeared.
Bottom line: Positive tech progress is a bullish crypto driver. Security breaches have the opposite effect—often immediately.
What Role Does Regulation Play?
Regulatory surprises can shift market sentiment faster than any other cryptocurrency driver. For example, a bullish policy shock occurred in October 2021 when the U.S. approved its first Bitcoin futures ETF. The move was seen as a milestone for mainstream acceptance, and Bitcoin surged to a new all-time high that same week as institutional money flowed in. On the other hand, bearish policy shocks have proven just as powerful. When China issued an outright ban on crypto trading and mining in 2021, Bitcoin dropped 30% within days, triggering a global sell-off. More recently, in 2024, legal threats in the U.S.—including SEC lawsuits against Binance and Coinbase—sent Bitcoin tumbling below $30,000, despite otherwise neutral macroeconomic conditions.
Ultimately, clear and balanced regulation tends to create tailwinds for crypto markets by boosting confidence and adoption. In contrast, ambiguous rules or aggressive enforcement actions often create headwinds that spook investors. This makes regulatory headlines one of the most influential crypto drivers to track closely.
Halvings, Whales, and Liquidity or Supply and Demand
All markets obey supply-and-demand laws, and crypto is no exception.
Programmed Scarcity
Bitcoin’s block-reward halving cuts new supply by 50% every four years. Historical data show strong rallies roughly 6–18 months after each halving as new issuance dries up. This structural scarcity remains a primary long-term crypto driver.
Whale Movements and Liquidity
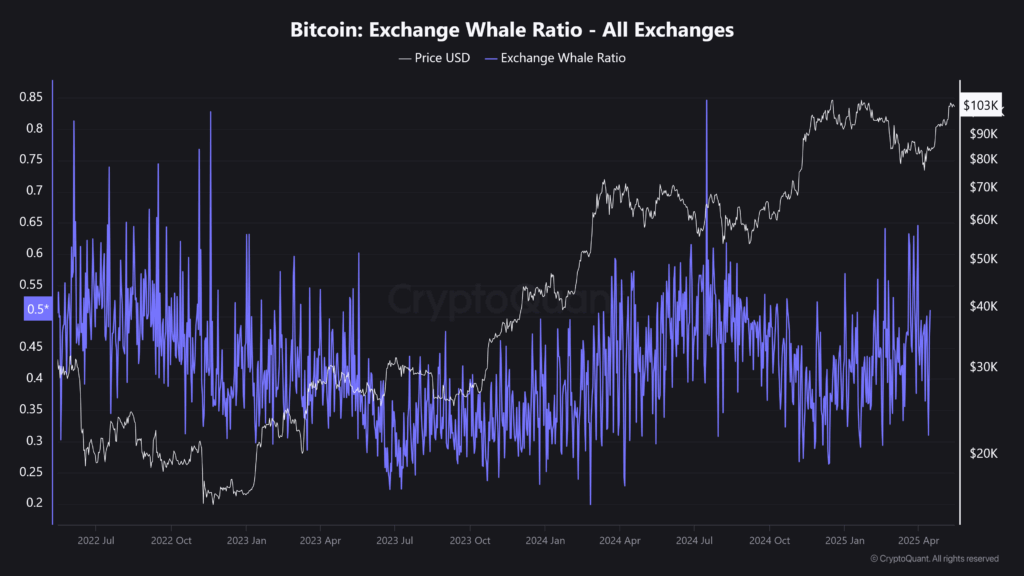
When large Bitcoin holders—commonly referred to as “whales”—transfer significant amounts of BTC to exchanges, it often signals potential selling pressure. Traders closely monitor these movements, as even moderate sell orders can trigger steep price drops in thinly liquid markets. The fear of incoming sell-offs tends to spread quickly, especially when exchange inflows spike.
Conversely, when whales withdraw BTC from exchanges and move assets into cold storage, it’s typically interpreted as a sign of accumulation and long-term conviction. These outflows have historically preceded major rallies. For example, in late 2020, both MicroStrategy and Tesla disclosed large Bitcoin purchases. Their accumulation helped fuel a broader market surge, reinforcing the view that whale behavior is a powerful indicator of directional momentum.
Where to track their actions? Here is one of the places.
Demand Shocks
Failures like Terra-Luna in 2022 and FTX in 2023 triggered cascading margin calls. As confidence vanished, demand imploded, leading to 30–70% drawdowns across the market.
TerraUSD (UST), an algorithmic stablecoin, lost its peg to the U.S. dollar, causing a rapid decline in its value. This depegging led to a death spiral for its sister token, LUNA, which plummeted from an all-time high of $119.51 to virtually zero within days. The collapse wiped out approximately $45bn in market capitalization and had a domino effect on the broader crypto ecosystem.
FTX, once a leading cryptocurrency exchange, filed for bankruptcy following revelations of mismanagement and misuse of customer funds. The insolvency of FTX and its sister trading firm, Alameda Research, led to a liquidity crisis, prompting a cascade of margin calls and forced liquidations across the market. This event further destabilized the crypto industry, leading to significant price declines in major cryptocurrencies.
Key insight: Monitor on-chain data, exchange reserves, and event-driven stress points. Shifts in supply or large wallet behavior frequently precede volatile moves, making this cryptocurrency driver crucial for timing entries and exits.
How the Crypto Drivers Interact
Although we can list each factor separately, they rarely act in isolation. Example: In March 2020, the COVID-19 panic combined a macro shock (liquidity crunch), terrible sentiment (global fear), and forced liquidations (market mechanics) to push Bitcoin down 60% in days. Yet the same crisis triggered unprecedented stimulus, which became a bullish macro driver. As liquidity flooded back and sentiment flipped, Bitcoin staged its biggest 12-month rally on record.
Thus, investors must weigh which crypto drivers are dominant at any moment. A dovish Fed may offset mild regulatory worries; a catastrophic hack might overpower positive macro data. Staying alert to the full driver set lets traders update their outlook when one factor takes the wheel.
Practical Checklist for Monitoring Cryptocurrency Drivers
Below is a streamlined checklist of where and how to watch each driver in action, from macroeconomic releases to on-chain metrics. Use these tools to spot shifts in sentiment, liquidity, leverage, and regulatory pressure before they show up in price.
Macro feeds
- Follow FOMC statements, CPI prints, and global PMI releases.
- Track the U.S. Dollar Index (DXY) and real yields for risk-on clues.
| Real yield trend | Investor incentive | Typical market effect |
|---|---|---|
| Falling / Negative (cash loses value after inflation) | Seek higher real returns elsewhere | Money rotates into risk assets—equities, high-yield bonds, crypto |
| Rising / Positive (safe bonds beat inflation) | Park capital in Treasuries for “free” real return | Demand for risk assets drops; valuations compress |
When real yields fall or stay deeply negative, the opportunity cost of holding risk assets drops—so crypto tends to get a tail-wind. When real yields climb, safe bonds become more attractive, liquidity drains, and risk assets struggle.
Sentiment Dashboards
- Use the Crypto Fear & Greed Index.

- Scan Twitter/X trends and Google search volumes around key phrases.
- Tech calendars
- Watch roadmap milestones (Ethereum upgrades, Bitcoin Core releases).
- Subscribe to bug-bounty and security-alert channels for breach news.
Regulatory Alerts
- Set news filters for SEC, CFTC, MiCA, and central-bank announcements.
- Monitor ETF approvals or denials; they often spark immediate moves.
On-chain Metrics
- Check exchange inflow/outflow, whale wallet activity.
The mempool (memory pool) is Bitcoin’s real-time “waiting room” of unconfirmed transactions. Every full node keeps a copy. When transactions are broadcast they sit in the mempool until miners include them in a block. The size of the mempool (measured in bytes or number of txns) and the fee levels inside it rise and fall with network activity.
| Mempool signal | What it tells you | Why traders care |
|---|---|---|
| Sudden backlog Mempool size & avg. fee per vByte spike | On-chain congestion; users bid up fees to get included in the next block | Often coincides with large exchange withdrawals or panic moves—can foreshadow selling pressure |
| Rapid clearing Mempool drains, fees fall | Network activity calms; lower urgency for confirmations | Suggests a lull after volatility; fewer large withdrawals/deposits |
Using this structured approach keeps all five cryptocurrency drivers in view and helps prevent surprise drawdowns or missed rallies.
Final Thoughts
Crypto markets can appear wildly unpredictable day to day. However, once you break price action into the five core crypto drivers—liquidity, sentiment, technology, regulation, and supply-demand mechanics—the fog clears. Each driver leaves measurable footprints: policy announcements, social-media spikes, network upgrades, legal rulings, and on-chain flows. By combining these signals, traders and investors gain a holistic picture of where the market stands and where it might go next.
Maintain a dashboard, stay alert to major calendar events, and remember that no single headline operates in a vacuum. When multiple crypto drivers align in the same direction, expect stronger, faster moves—and position accordingly.